Shippers should be tracking these last-mile metrics to drive down the high cost of last-mile logistics.
This post comes to us from Adam Robinson of Cerasis, a top freight logistics company and truckload freight broker.
Using technology to improve last-mile metrics is essential to driving last-mile costs down, but how do shippers know if the technology is helping or hurting? The answer to this question lies in using last-mile metrics to track key performance indicators and target levels of service to ensure accountability, visibility and continued reduction of costs in last-mile delivery.
A recent survey of customer service experiences, reports DC Velocity, revealed many retailers feel current technologies do not address their customer service needs, and as few as 3 percent of retailers cite full support as part of their current systems. Unfortunately, history teaches shippers that reducing costs means cutting customer service, but integrating customer service data into delivery operations and transportation systems is key to increasing a brand’s value. In fact, 72 percent of survey respondents believe it is very important to improve access to data for in-transit shipments, which includes last-mile delivery. Essentially, shippers need to track these 11 metrics.
1. On-Time Deliveries Are King of Last-Mile Metrics
The number of on-time felt or late deliveries are more important than any other metric tracked in last-mile logistics. These metrics provide a quick yes or no analysis of the effectiveness of your last-mile logistics strategy.
2. Fuel Consumption Rates
Last-mile metrics involving fuel consumption rates can vary and depend on the preference of the company, but how fuel consumption rates are calculated can greatly influence whether a driver is saving or wasting fuel.
For example, overall fuel consumption costs may be lower, but interval-based fuel consumption rates could show consistent, stopping and starting patterns that do not coincide with existing routes and drive up fuel costs. As a result, fuel consumption rates should be calculated by averaging the total fuel costs per driver, all drivers, per delivery vehicle and per route.
3. Last-Mile Vehicle Capacity Used Versus Available
Last-mile logistics should also consider the capacity utilized against the available capacity in all last-mile delivery vans. This metric is calculated by dividing the available capacity by the total capacity. Excess available capacity rates allude to poor loading procedures or the need to consolidate routes. The same calculation is used to calculate capacity used, dividing the capacity used by total capacity.
4. Planned Versus Actual Mileage
Planned versus actual mileage last-mile metrics are calculated by dividing the actual mileage per vehicle, driver, or route by its own planned mileage. Higher actual mileage rates reveal problems with route planning or unforeseen detours to route schedules.
5. Driver Hours In-Motion and Stationary
In-motion and stationary driving hours are expenses in last-mile logistics, and, unless your company employs a fully autonomous and drone-assisted delivery network, stops are necessary. However, the amount of stops and hours of both in-motion and stationary position can help measure performance of drivers. Excess stationary hours or excess in-motion hours are calculated by dividing the total amount of time drivers spend on a route by the number of hours in motion and the number of hours stationary.
6. Cost Per Item, Per Mile, and Per Vehicle
Last-mile metrics should track the cost per item, per mile, and vehicle associated with a specific route and the company as a whole. As a result, shippers should average the total costs per item for a given route and for the company’s shipments over a set period. The same average process should apply to both mile and per vehicle metrics, too.
7. Number of Stops
Last-mile logistics and metrics should also track the number of stops per vehicle. This is important to monitoring fuel costs, but it can also allude to poor route optimization practices. In other words, vehicles with a high number of stops should be reevaluated for ways to improve route schedules.
8. Average Service Time
The average service time metric can be complicated because it involves different data to calculate, depending on the source of an order. Most commonly, it is calculated by dividing the total service time at the store by the total number of deliveries. In other words, what is the average amount of time spent per order between the store, the warehouse, and other pre-shipping processes?
9. Customer Complaints
The need to manage customer service and address customer complaints leads to another metric in last-mile logistics, reports Talking Points With Adrian Gonzalez. What is the total number of customer complaints, and how do they stack up against the total number of deliveries? This metric is calculated by dividing the total number of deliveries by the total number of complaints received.
10. Order Accuracy
Order accuracy is calculated by comparing the known inaccuracies of orders against all shipped orders. Since some consumers may never report inaccurate orders, it is difficult to track a specific order inaccuracy metric. Instead, shippers should track order accuracy rates by dividing the total number of shipped orders by the number of orders not subject to customer service disputes, calls or complaints.
11. Damage Claims
A final last-mile metric to track is also about problems with orders: damage claims. Shippers should track the number of incoming damage claims against the total number of shipments. This is calculated by dividing the number of damaged claims by the total number of shipments. The resulting value is the percentage of damage claims in decimal form.
Using Metrics, Shippers Can Improve Last-Mile Logistics
Metrics allow shippers to understand the ins and outs of last-mile logistics, and metrics provide a means of measuring the performance of last-mile logistics plans against actual processes and their associated costs. As a result, shippers can make changes to their operations to improve last-mile services through last-mile metrics, and knowing more about last-mile needs is key to providing more than just the standard last-mile delivery options.
You may think it should be simple: Write, post, get more customers. But content marketing is much more complex, demanding more time, thought, and careful strategy than churning out a few blog posts.
First and foremost, what you produce must engage readers. This is, however, one of the biggest content marketing challenges facing both B2B and B2C marketers.
In fact, the 2017 State of Inbound Report found that content creation is just the tip of the iceberg in terms of content marketing challenges that businesses face. Here are 3 marketing challenges and ways to track your progress in overcoming them.
3 content marketing challenges
1. Generating traffic and leads
Echoing their priorities, marketers today find generating traffic and leads to be their biggest challenge. In fact, 61% of those surveyed listed it as their number one challenge. ‘Content is king’ has become a marketing mantra, but how can you turn your content into actual leads that turn into sales?
Tying revenue directly to publishing and distributing content can be difficult. Thinking about social media content within the context of your entire sales funnel can make it easier to determine effectiveness. Content is typically used to attract leads, to encourage readers to subscribe to your blog, or to have prospects submit contact info to get higher-value content. Continued engagement nurtures leads and moves them further down the sales funnel.
Track this: The cost to get a lead. You can then determine the percentage of leads that move on to become qualified leads, the percentage of qualified leads that then become opportunities, and the percentage of opportunities that are ultimately won. At the end of the day, you’ll be able to calculate the revenue generated from leads that entered the funnel from your content marketing efforts.
2. Proving the ROI of marketing activities
Coming in at a close second, 43% of marketers felt that proving their ROI from content marketing activities was their biggest challenge.
Whether launching a product or a new social media campaign, we look for instantaneous numbers that will affirm we made the right choices. But here’s the problem: Not all metrics are created equal. Content marketing ROI is harder to confirm than checking a few quick numbers.
Lean-startup pioneer Eric Reis said, “The only metrics that entrepreneurs should invest energy in collecting are those that help them make decisions.” In other words, measuring your ROI will tell you if an effort was profitable so you know where to put your time and money.
ROI can help you determine whether it was worth spending your resources in a particular way. This is extremely useful on platforms like blogs and social media, where things are constantly changing. Using ROI as a litmus test, you can keep experimenting and making sure you’re using these tools effectively.
Organizations that have a documented content marketing strategy are more likely to be successful than those that don’t. But setting aside the funds to develop and implement these strategies can be tricky.
The State of Inbound Report found that 30% of marketers struggle to secure a budget for their marketing efforts. Content marketing competes with other marketing campaigns (outbound, native, etc.) for funding. The Content Marketing Institute’s latest trends report states that, on average, 29% of B2B brands’ total marketing budget is spent on content marketing, leaving a majority of funding going toward other efforts.
Content marketing is here to stay. In fact, it’s at its best when it’s integrated with your other marketing efforts, becoming a part of your entire marketing strategy.
Track this: Content marketing serves every marketing channel. Experiment with overlapping marketing budgets to increase your efforts for whitepapers, sales collateral, social media posts, and to make sure your advertisements and visual messaging are in sync. Content serves every marketing channel, so you’re wasting time claiming you don’t have the budget.
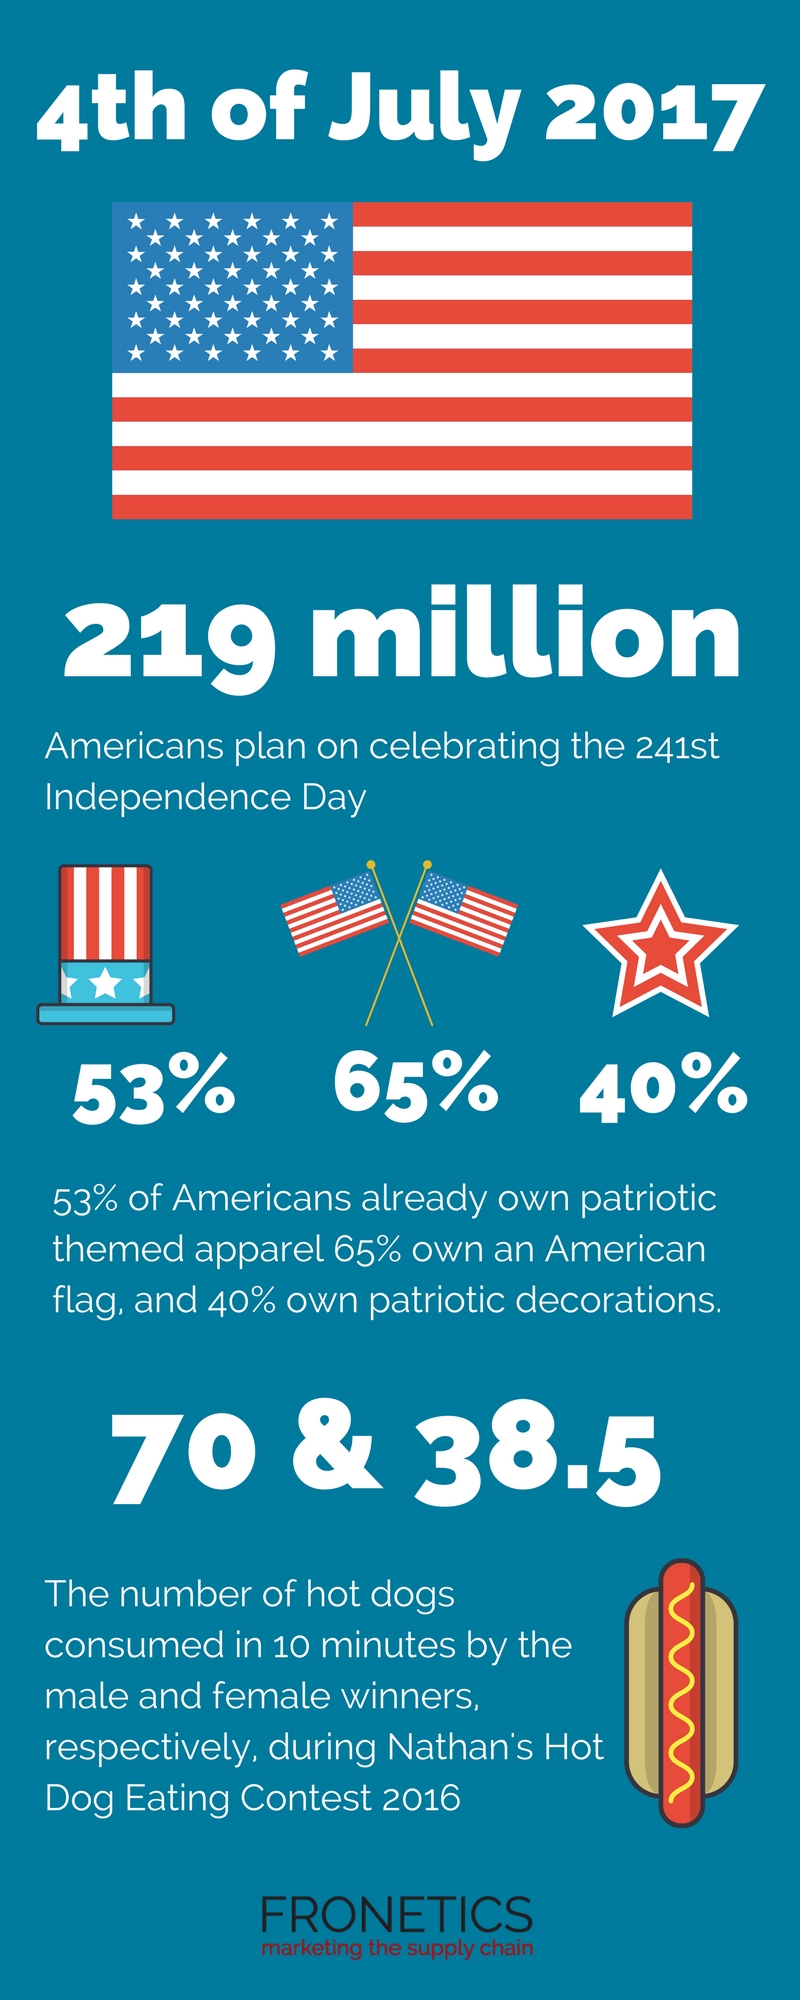
U.S. Consumers plan to spend a whopping $7.1 billion on cookouts for 4th of July celebrations.
The National Retail Federation reports that 219 million Americans plan to celebrate the 241st Independence Day. Two-thirds plan to attend a cookout, barbecue, or picnic, spending an average of $73.42 per household on food items, up from last year’s $71.34. That’s a lot of hot dogs!
And what’s a Fourth of July celebration without fireworks? 44% of Americans plan to attend a fireworks show or community celebration. The U.S. will use approximately 285.3 million pounds of fireworks, totaling $1.09 billion dollars. More than 15,000 firework displays will glitter the skies to mark the special occasion.
Recognized as the nation’s largest Independence Day celebration, the Macy’s 4th of July Fireworks display attracts more than 3 million spectators live and over 10 million TV viewers. The firework display in Washington, D.C., comes in second with over 700,000 viewers from the nation’s capital.
And due to a number of factors — including strong employment and the low price of gasoline — a record number of people will travel out of town this year to celebrate the holiday. NRF estimates 32.9 million, while AAA estimates it will be closer to 44.2 million travelers.
At Fronetics, we wish you and your family a safe and fun Fourth of July celebration. Here are a few more fun facts to get you into the patriotic spirit.
A 2017 4th of July Infographic for the Supply Chain
Building brand awareness is one of the key benefits of content marketing, but it’s notoriously difficult to measure. Until now.
Content marketing is a long-term solution through which a business establishes a relationship with and earns the trust of target customers. It’s called building brand awareness. Drawing the public’s attention to — and heightening their knowledge of — your business ultimately generates leads that turn into sales, after all, which is the end marketing objective.
Let’s be honest: This doesn’t happen overnight. And it’s often difficult to quantify (as opposed to a vanity metric, such as website visits). But that’s not a reason to throw in the towel. There are ways to measure the work that you’re putting into your content marketing program. And, more specifically, there are ways to measure brand awareness.
4 metrics that indicate you’re building brand awareness
1) Social media reach
The reach of your social content has a direct impact on your brand awareness. The larger the reach, the larger the potential audience.
Twitter originally had an internal tool that tracked how many times a tweet had been shared, but stopped supporting this data back in 2015. So where do you go to track your social media reach?
Sharedcount is a free online tool that allows you to track the number of times a piece of content has been shared on social media, including Facebook, LinkedIn and Google. Sharedcount is an easy way to get basic information about your social reach, so you can spend less time tracking tweets and more time producing your content.
2) Brand mentions
There’s a great deal of value to be gained from monitoring discussions about your brand online. Tracking brand mentions can lead to honest feedback and objective insight from potential leads.
There are several options you can use to track brand mentions. We prefer the ease of Google Alerts, which allows you to easily set up a custom alert, or Hootsuite, where you can track brand mentions, as well as specific keywords and phrases, across all of your social media feeds.
3) Blog shares
By adding a share bar to your blog posts, you make it easy for readers to share your blog content on social networks, spreading awareness about your content and your brand through the amplifying effect of social media.
These share bars are easy to set up and even easier to monitor. By measuring your average number of shares per blog, you can track what content your users are drawn to and what pieces fall flat.
4) Search volume
One of the main sources of traffic for most websites is through simple searches. If people are searching for your company or products, that’s a pretty solid indication that they are aware of your brand.
Using online tools, such as Google Adwords or Moz, you can track the searches for your products, blogs, social media platforms, and any other variation that you find useful. These tools are free, easy to use, and perfect for determining if your company is popping up when customers are searching.
Content marketing takes time, but there are hints along the way that your efforts are working. Using these tools to measure brand awareness offers clues that customers are finding your company in their search efforts. If the needle is not moving in a positive direction, always adjust your strategy to until you find what works for your business.
Analyzing the right metrics is crucial to determining whether you are achieving content marketing ROI.
We all want to see the fruits of our labors. Whether launching a product or a new social media campaign, we look for instantaneous numbers that will affirm we made the right choices. But here’s the problem: Not all metrics are created equal. Content marketing ROI is harder to confirm than checking a few quick numbers.
A spike in homepage hits may be the result of your marketing efforts, or it may be because of ghost spam. (Or, both.) Regardless, more visits do not necessarily correlate to increased revenue — just more visits. Even so, 83% of B2B enterprise companies (over 1,000 employees) use web traffic as their main metric for measuring content marketing ROI.
The number of email subscribers is another common success metric. But, again, having 100,000 email subscribers means nothing if only 0.001% are opening them. You actually could be losing money in terms of resources allocated if the emails aren’t helping drive sales. That’s why it is crucial to focus on your company’s return on investment (ROI). You could waste hours reviewing a hundred different analytics that tell you nothing about how revenue was affected by a particular effort.
Know where to allocate resources
Lean-startup pioneer Eric Reis said, “The only metrics that entrepreneurs should invest energy in collecting are those that help them make decisions.” In other words, measure the things that will tell you if an effort was profitable so you know where to put your time and money.
ROI can help you determine whether it was worth spending your resources in a particular way. This is extremely useful on platforms like blogs and social media, where things are constantly changing. Using ROI as a litmus test, you can keep experimenting and making sure you’re using these tools effectively.
According to our Social Media Use Report, 81% of respondents wanted a tracking and measuring tool to prove their ROI. Your resources are limited, so it’s crucial to evaluate your efforts with meaningful numbers that illustrate their affect on your bottom line.
So what are they best metrics to use? Here are three of our favorite tools.
3 tools for measuring content marketing ROI
1) Built-in Social Media Analytics Tools
Most social media platforms have their very own built-in tools that give you detailed information about engagement with your content. Even better, most of these tools are free. Twitter Analytics, Facebook Insight, and YouTube Analytics are just a few examples of tools you can use to measure exposure and engagement with your followers. This priceless information will help you gain a better understanding of your followers and the content they are drawn to.
2) Hootsuite
Hootsuite promotes smarter, data-driven social media marketing decisions backed by real-time analytics that allow you to spot trends as they develop and drill down for insights on how your social content is performing. It takes all your top social media platforms (Twitter, Facebook, YouTube, LinkedIn) and combines them into one application for full-scope results.
3) HubSpot
Measuring ROI through HubSpot is both accurate and convenient. HubSpot sends you weekly updates on your campaign performance and allows you to pull any reports of your own. Standard analysis includes: visits, leads, percentage changes, submissions, bounce rate, downloads, and much, much more. HubSpot Marketing Analytics can identify blog articles, landing pages, emails, and social media posts that perform well in terms of specific keywords.
Calculating ROI might take some time — both in the few extra minutes to do the math and the amount of time that needs to pass before all the data is available — but that number will be invaluable to you.
Let us help you get started. We’ve created a monthly marketing reporting template just for you. This template tracks your marketing metrics and generates graphs you can use in reporting and presentations. Click the button below to get the template (an Excel document) now.
Our series by MBA students and graduates at Peter T. Paul College of Business and Economics highlights some of the most pressing issues in supply chain management today.
A few years ago, the Wall Street Journal called supply chain management the “hot new MBA.” Many universities have been introducing related degree programs, majors, and concentrations in response to a growing demand for new hires with supply chain expertise. Graduates of these programs are heavily recruited by employers, which is helping to attract ambitious, young talent to the industry.
Fronetics had the opportunity to collaborate with some of these rising stars by inviting MBA students from the University of New Hampshire Peter T. Paul College of Business and Economics to author guest posts on our blog. They covered a variety of pertinent topics, from the Internet of Things and Big Data to pet food and Chipotle. Their pieces are summarized below.
In the coming weeks, we’ll be partnering with another MBA class at UNH to author a second series of posts covering some of the most pressing issues in supply chain management today. Make sure you receive our blog e-newsletter (sign up to the right) or follow us on social media so that you don’t miss out.
Steve Mondazzi writes about how the Internet of Things is now being used to improve factory workflow, increase material tracking, and optimize distribution to maximize revenues. Everything from turning lights on and off to security systems can be controlled from your smartphone, and that technology is moving to the manufacturing industry. Mondazzi examines Mark Morely’s theory that the IoT will impact the industry in three main ways: pervasive visibility, proactive replenishment, and predictive maintenance. He also explores hurdles to implementation — such middleware and a common protocol for businesses regarding IoT. Read article
Mikayla Cadoret focuses on the barriers to entry in the pet food industry. New brands have three options: manufacture product themselves, choose a co-packer who uses a private label, or choose a co-packer who will manufacture the food to the specifications of the brand. She discusses the challenges of those choices as well as high-profiles recalls resulting from co-packer error. She recommends strategies that companies implement to keep tabs on co-packers’ sourcing and manufacturing. Read article
Nicole Brooks explores Amazon’s mission to be earth’s most consumer-centric company. The e-commerce giant not only offers low prices, it also exceeds consumer expectations and shifts industry standards with benefits like same-day shipping. Brooks examines Amazon’s biggest technological assets, and looks forward to up-and-coming innovations like Kiva robots in warehouses, drones, Prime Air, and Amazon Business. Read article
Corey Ducharme discusses the traditional four-step problem-solving method and how it isn’t effective in solving needle-in-a-haystack issues resulting from limited business resources. Six sigma can address these issue with its six-step process. With the addition of an analysis phase, solutions become more effective, leading to better results and higher revenue for businesses. Read article
David Chadwick explores whether advances in radio-frequency-identification technology (RFID) will render humans obsolete in the supply chain. RFID could dramatically improve efficiency and accuracy in warehouses by reducing the need for human interaction. But it is uncertain to what degree this technology will be implemented in all aspects of supply chain management. Read article
Dario Cavegn discusses how increasing size and complexity of global supply chains open them up to increased risk. Supply chain disruptions can vary from insignificant to extremely threatening. But regardless of disruption size, supply chains can remain resilient with a business continuity plan, which acts as a road map to continue operations during or after a disruption. Cavegn outlines the development process from analysis to feedback. Read article
Josh Hutchins explores the limitations of big data. The real value lies in the analytics applied to the data. As an example, Solid Gold Bomb drove its prospering t-shirt business into the ground from an oversight and misapplication of data. Hutchins concludes that companies must have an intimate understanding of big data applications to avoid a similar fate. Read article
Michael Hickey discusses third-party logistics providers as a resource for a company’s operations arm. 3PLs offer an outsourcing opportunity for order fulfillment, inventory and warehouse management, as well as transportation of finished goods. But businesses should ask themselves these questions when determining whether a 3PL is a good fit for their needs. Read article
Sarah Hebert discusses Chipotle’s high-profile pork-supplier conundrum. The chain cut their pork supply by a third due to a supplier’s violation of their animal welfare standards. While this affected sales by 7-8%, Chipotle embraced the situation as a strategic PR opportunity. But behind the scenes, the company was scrambling to address long-term supply concerns associated with its rapid growth. Hebert asks, “At what point do you scale back the growth for the sake of maintaining brand integrity?” Read article
Connor Harrison discusses GM’s recall of 2.6 million vehicles. The company’s faulty ignition switches were linked to 13 deaths and 31 front-end collisions, but the company managed to contain the crisis. Harrison examines the root causes of the issue, including faulty ignition switches from GM’s supplier Delphi, a strained business relationship, and legal complications. Read article