by Elizabeth Hines | Oct 2, 2014 | Big Data, Blog, Data/Analytics, Strategy, Supply Chain
Big data is big. It is revolutionary. It is transformative. But what the heck is it?
MIT’s Technology Review does a great job of outlining the hype and the confusion around big data:
“There is unanimous agreement that big data is revolutionizing commerce in the 21st century. When it comes to business, big data offers unprecedented insight, improved decision-making, and untapped sources of profit.
And yet ask a chief technology officer to define big data and he or she will stare at the floor. Chances are, you will get as many definitions as the number of people you ask. And that’s a problem for anyone attempting to buy or sell or use big data services—what exactly is on offer?”
Research conducted by Accenture highlights this dichotomy. Eight-nine percent of survey respondents reported that they believe big data will revolutionize business operations in the same way that the Internet did. Seventy-nine percent of respondents reported that “companies that do not embrace big data will lose their competitive position and may face extinction.” However, the research found that companies hold “differing views of data sources and uses,” and that “valuable data sources are omitted or overlooked.”
Big data and the supply chain
Accenture’s Global Operations Megatrends research looked at big data analytics in the supply chain. Ninety-seven percent of supply chain executive reported that big data analytics can benefit their supply chain. Their expectations for big data analytics include: creating an organizational ability to react more quickly to changes (48 percent); helping their company gain insights about the future (45 percent); and achieving a cross-functional view of the supply chain with the objective of optimizing overall supply chain performance (43 percent).
Although the majority of executives believe big data analytics will benefit their supply chain only 17 percent of survey respondents reported that their company has already implemented analytics in one or more supply chain processes/functions. Accenture makes this supposition:
“While there is considerable hype about, and a high level of general awareness of the value of, ‘big data,’ many companies still do not fully understand how to apply analytics to this data to drive higher supply chain (and overall enterprise) performance.”
Given Accenture’s research, as well as that conducted by Jonathan Stuart Ward and Adam Barker at the University of St Andrews in Scotland, I’d take this one step further. In spite of the hype (or perhaps because of it) there remains confusion regarding what big data actually is. Without a clear definition and understanding of big data, it is (and will continue to be) a challenge to implement big data analytics. Before we realize transformation we need to get to understanding.
by Elizabeth Hines | Sep 10, 2014 | Blog, Data/Analytics, Marketing, Strategy
Metrics matter. Metrics allow you to measure success, drive strategy, and demonstrate the ROI of your marketing efforts. Conversions are one of the most important metrics to monitor.
Why conversion rates matter
What is a conversion? A conversion means action. It means that someone took some action that entered them into your funnel or moved them further down your funnel. Examples of conversions are: downloading a white paper, filling out a form, requesting information, opening an email, and becoming a customer.
By monitoring and tracking conversions you can determine what marketing efforts are paying off. Additionally, by monitoring and tracking conversions you can identify which efforts need to be re-evaluated or even discontinued. In short, conversion rates can help you measure your ROI.
Why conversion rates don’t matter
Conversion rates are not the Holy Grail of metrics. Your website should be a magnet. It should attract and engage prospective customers and current customers. Your website should serve to educate and to establish your business as an industry leader. Eighty to 90 percent of prospects are not ready to make a purchase when they first engage with your company. Conversion rates don’t capture the amount of time people spend on your website, learning, exploring, and getting to know your business. Conversion rates also do not capture the amount of time current customers spend on your website – valuing your company as a resource.
While conversion rates are an important metric to measure, remember that they are not the end all be all.
Tracking conversion rates
We created a template that you can download and use to track conversion rates and other critical metrics. While the template captures visitor-to-lead and lead-to-customer conversion rates, you can easily modify the template to include additional conversion rates that are useful to your business.


by Elizabeth Hines | Sep 2, 2014 | Blog, Content Marketing, Data/Analytics, Marketing, Supply Chain

To grow your B2B business you need to take a comprehensive data driven approach to marketing. Metrics enable you to measure success, drive strategy, and demonstrate the ROI of your marketing efforts.
What metrics should you track?
Given that your objective is to attract, acquire, and retain customers, the most effective metrics to track are those where the unit of focus is the prospect, lead, or customer. These include the following:
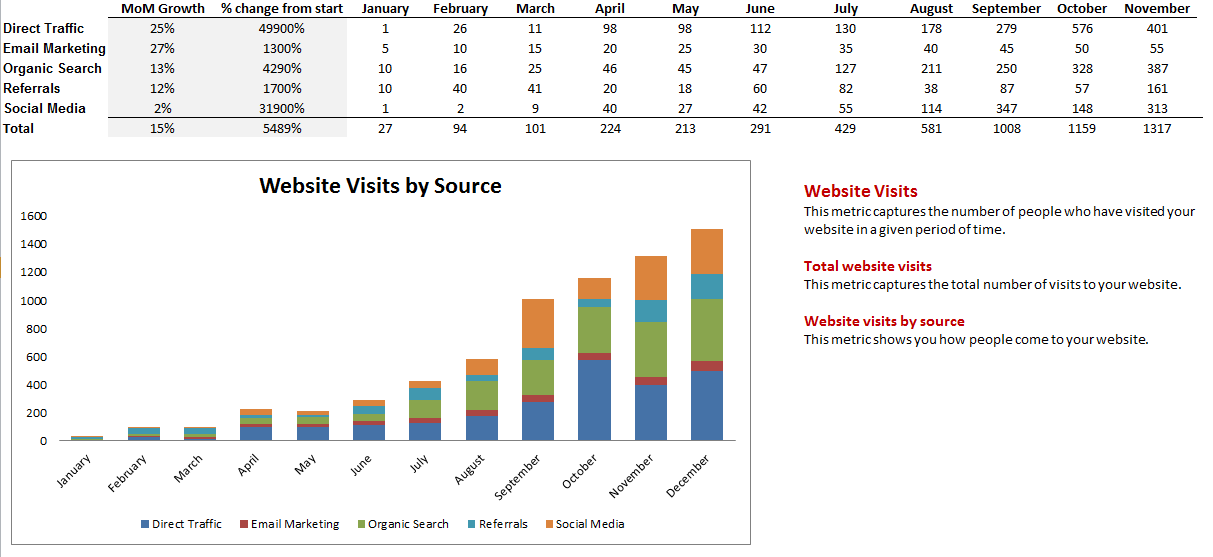
Visits
Visits capture the number of visitors to your company’s website in a given period of time. In addition to tracking the total number of visits, it is also important to track visits by source. That is, how visitors come to your website. Sources typically include direct traffic, organic search, referrals, social media, and email marketing.
Reach
Reach is the number of people who can be reached through your marketing channels (e.g. LinkedIn, Twitter, and Facebook). This metric is a good indicator of how well the content you are publishing attracts new people to your network, and how well the content engages people within your network. In addition to tracking your company’s total reach (the total number of people you can reach across all channels), you should also track reach by channel.
Leads
Leads are one of the strongest indicators of ROI. By tracking leads by source, you can identify where your marketing efforts are most effective, areas where you can improve, and areas you could eliminate from your strategy.
Customers
Customers are also a strong indicator of ROI. Like leads, customers should be tracked by source.
Conversion rates
Conversion rates measure the percentage of people who are moving from one marketing stage to the next. An increase in your conversion rates implies an improvement in the quality of your content and/or traffic. You should track the visit-to-lead conversion rate (How many of your website visitors are becoming new leads?) as well as the lead-to-customer conversion rate (Are you generating sales-ready leads?).
Ranking
Ranking matters. The top listing in Google’s organic search results receives 33 percent of the traffic compared to 18 percent in the second position. Two metrics you can track are your domain authority and your marketing grade.
Domain authority is a score ranging from 1 to 100 that represents how well a website will perform in a search engine ranking. The lower the score – the less likely it will be found. Marketing grade is a holistic measure of a site’s online presence as measured by HubSpot’s Marketing Grader on a scale of 0-100. A higher score is better.
How to track metrics for success
Having an established database to capture your marketing metrics is critical to success. We created a template that you can download and use to track your metrics, measure success, and drive strategy. One of the great features about this template is that it generates graphs that can be used in your reports and presentations.
by Elizabeth Hines | Jul 31, 2014 | Blog, Data/Analytics, Strategy, Supply Chain
Want to have a better-run business? Define clear metrics and use them as a launch pad to move your organization forward.
Metrics enable you to operate more effectively and efficiently because they provide you with valuable information on how you can drive improvement and how you can apply resources (people, time, money) to the activities and programs that will get you to where you need to go.
Critical metrics for effective business are ones that focus on the strategic goals of your organization. Here are five metrics every business can benefit from using:
Financial metrics
Make sure you have, at the very least, a quarterly plan in place. A yearly plan is ideal, but a quarterly plan is a good starting point. Track against your plan. Looking at financials in aggregate is not a helpful exercise. Rather, look at your financials on a granular level.
Business metrics
Determine what makes your customers happy and what enables your organization. Track these. Soon, you will know what you should do more of and what should be cut back.
Customer metrics
Determine the who, what, when, and why of your customers. Knowing what matters to them will help you understand how to serve them better.
Vendor metrics
Determine the who, what, when, and why of your vendors. Relationship management and partnering can only be built on a strong foundation.
Quality metrics
When it comes to quality it is important to look at anything and everything. That is, the quality of your products, the quality of your relationships with your clients, the quality of work your employees produce… Start tracking all of this.
Track the data
Develop tracking methods for each of these five metrics. Archive the data. Learn by studying the results on a regular basis. You’ll start understanding how to drive the direction of your organization. You’ll develop a focus for your organization and your performance. You’ll be able to make better decisions and drive performance.
Although most (if not all) of the material will be used internally, you should make sure that it is “external facing ready.” What you are creating is a database that you can query when you need it. In the end, you’ll have, at your fingertips, a decision database to run a better business.
by Jennifer Hart Yim | Jun 12, 2014 | Blog, Data/Analytics, Strategy, Supply Chain
This article is part of a series of articles written by MBA students and graduates from the University of New Hampshire Peter T. Paul College of Business and Economics.
Regularly tracking your relationship with your suppliers and their performance toward your expectations is critical to ensure the success of your business. One mechanism for tracking this is the supplier scorecard. A scorecard is in essence a report card for your supplier. Supplier scorecards when used effectively can help maintain a healthy supply chain and will benefit both parties. If not used effectively supplier scorecards can damage the supplier relationship and hurt both businesses.
Effective scorecards should use meaningful metrics. If it doesn’t align with business goals then it shouldn’t be measured. Easily measured variables of no importance will just cause clutter; they could also cause a supplier to focus their performance in areas that do not matter. If the metrics are not clearly defined and understood by the suppliers then it will be hard for them to adjust their performance in these areas. Another consideration is there may be things that are important to you which your suppliers have no way of measuring or attaining the performance you are asking for.
As with all business to business relationships communication is critical for maintaining and improving supplier performance. To ensure suppliers meet your needs you should communicate to them from the offset how their performance will be measured. You can even tie bonuses and penalties into their performance scores. You should be mindful that your relationship with your supplier should be collaborative; as you grow so should they. You should share the results of your scorecards with your suppliers on a regular basis and shouldn’t wait until a review to raise a concern. Another important aspect of communication is sharing your business objectives and performance data with your suppliers. This can help them to better shape their business to meet your needs as your business fluctuates.
It is important when evaluating suppliers to have a good process in place for tracking important metrics. When possible it is best to use accurate data that is understood by both you and your supplier. If you use fuzzy metrics which are subjective then improvements become difficult to measure and target. Also, tracking metrics throughout the scoring period will help to ensure the data is accurate and your scorecard reflects actual performance.
When dealing with different suppliers it is important to make sure the metrics you are evaluating are relevant to each supplier. As a result it is not recommended to use a one size fits all approach to supplier scorecards. Another thing to keep in mind is that you may be sourcing from the same supplier through multiple locations. It is important to track each of these on its own scorecard to help your supplier learn where they are doing things right and where they are falling short of your expectations.
Where I work we have several strategic supplier partnerships. The way we manage supplier relationships is through quarterly business reviews with each of our partners. In these meetings high level representation from both companies is present. We share with our partners our business results and forecasts in addition to any major company news. After sharing this information we review our scorecard process with the suppliers, show a score card comparison, take a detailed look at each rating, and then provide an overall summary.
Our scoring system looks at aspects of quality, delivery, cost, support, and inventory management. With respect to quality we look at hard numbers like failures out of the box and returns from our customers. We take into account both product quality and process quality. When it comes to delivery we measure on-time delivery, missed shipments, and lead times. Some of our customers have long term fixed cost agreements so this metric isn’t required, for others the cost fluctuates; we measure whether or not their costs are in line with our expectations. Support has several levels including technical support, order support, and special cases. Inventory management tracks how well they are able to maintain some inventory on hand for us.
Our scorecard metrics used to be scored on the basis of a five point scale from far below expectations to far above expectations. After running through several of these scorecards we determine that it was not likely to get exceeds expectations because the only time expectations could be exceeded is if our demand was well above our forecasts. Since this goal wasn’t something attainable by a supplier of their own action we adjusted our scorecard to have only three levels, from below expectations to meets expectations.
The scorecard comparison is unique to the supplier and it shows the ratings for each of the metrics for the current review period as well as four prior quarters. We display this in a color coded matrix so that it is easy to see where each metric is improving, staying the same, or regressing from period to period. For my employer these quarterly business reviews give us frequent touch points with our suppliers. This helps us to identify issues and areas for improvement to strengthen our supplier relationships and our business.
Throughout this article I have hit on several best practices with respect to supplier scorecards. I want to stress that this is just a tool. The fact that you have a scorecard system in place should not prevent you from acting immediately if issues present themselves. After all, this should be a collaborative exercise which will benefit both your company as well as your suppliers. In addition it is important to solicit internal feedback from interested parties. Supplier scorecards should be used to make decisions about whether or not to continue supplier relations or to pursue alternative suppliers.
Mike Cleary is a Software Quality Assurance Engineer at Empirix pursuing his Masters of Science in Management of Technology from the University of New Hampshire. He has over ten years of experience in testing IP and telephony solutions across a variety of platforms. In his current role he is responsible for not only ensuring Quality in the E-XMS solution but other administrative tasks such as lab configuration, VM server, and perforce administration.

by Elizabeth Hines | Mar 11, 2014 | Blog, Data/Analytics, Marketing, Social Media, Strategy
How people access your website and navigate your website can provide you with a lot of information not only about your website’s visitors, but also about your company and the products and services you provide. Unfortunately, many companies don’t know that this information exists and therefore they leave a wealth of strategic data unexamined. The data does exist – and it is free and easily accessible.
This goldmine of strategic data is available via a tool called Google Analytics. Google Analytics provides users with powerful data about website traffic. The amount of data available through Google Analytics is massive. Likewise the knowledge one can learn from the data is massive. Here are just four things Google Analytics can tell you:
How many customers actually look at your website
Having a website is essential. However, a website does your company no good if customers are not finding your website and are not accessing the site. Google Analytics provides you with data on the total number of visitors to your site as well as the number of unique visitors and the number of new visitors.
How visitors use your website
Google Analytics provides data on the path each visitor takes when they visit your site. You can follow the path of each visitor – from the first page they looked at, to the last page they looked at. This information give you information on what drew the visitor to your site, what they were looking for, what they were interested in once they arrived, and provide you with information on why they left the site. For example, did they leave once they made a purchase? Or did they not find what they were looking for and leave your site immediately?
What visitors like and what they don’t like
Google Analytics provides data on the number of visitors per page. By looking at this information you can tell what products or services are most popular and what are the least popular. From this you can make strategic decisions about your company’s products and services. For example, is it time to revamp your product line? Or do you just need to revamp your website content?
How do visitors view your website
What technology do visitors use when viewing your site? Do they use a mobile device, a tablet, or a computer? Knowing this information will help you to optimize your site so as to cater to your visitors. For example, if you find that the majority of visitors are accessing your website via a tablet or mobile device you want to make sure that your website is friendly to this technology.
What are your website’s traffic sources
Google Analytics breaks down traffic sources into four categories: direct, referral, organic search, and social. Once you know how traffic is coming to your website you can make necessary adjustments to your marketing and advertising strategies. Furthermore, you can identify which strategies currently in place are working and which are not.
Setting up Google Analytics is free and is relatively easy. Google provides a step by step guide, and there are also a number of YouTube videos available. Once you have set up Google Analytics use it – and use it to your advantage. The data provided is real time and will therefore enable you to understand what you need to do now in order to attract customers and engage customers.