by Elizabeth Hines | Apr 1, 2015 | Big Data, Blog, Data/Analytics, Logistics, Supply Chain
A distribution center struggling with a high number of forklift truck impacts found a way to leverage big data to address a nagging, costly warehouse issue. The company had installed a telematics solution on its forklift trucks, but could not determine the cause of the impacts. The time and location of impacts were known, as well as the identity of the drivers involved, but the company still needed to pull in more data sources for an effective assessment.
Forget for a moment the potential of adopting big data analytics throughout the entire supply chain and consider instead how big data can untangle and integrate seemingly unrelated masses of data to solve small problems in a warehouse or distribution center. That’s exactly what this company did.
By analyzing the link between environmental factors inside the distribution center and the forklift impact records, the culprit was swiftly identified: fast-moving thunderstorms that caused the humidity level to rise so quickly that the dehumidifiers could not keep up, increasing the risk of drivers losing control on the slippery concrete floor. That knowledge helped the company prevent sliding accidents by using a function of the telematics solution to reduce the maximum speed of the trucks when the humidity hit a certain level.
Indeed, distribution centers and warehouses present ideal environments — microcosms — for big data applications. Modern facilities are loaded with sensors and detectors to track every pallet and every piece of material handling equipment in real-time. Managers see the benefits in increased productivity, improved inventory flow, optimized equipment usage, and more. However, for that Eureka moment, organizations should also apply big data analytics across these multiple sources of data to uncover patterns that will drive even more, and perhaps surprising, operational improvements.
Rather than looking at data in isolation, a holistic approach holds significantly more power. Managers typically keep careful track of the performance of lift trucks, batteries, and chargers. But it is not until those entities are reviewed as a single system and matched with data coming off the lift trucks that a new level of revelations can be had.
Look for big data analytics to further raise the IQ of our “smart” warehouses and DCs. Inbound Logistics sums it up this way: “Accessing the right information to make smart decisions in the warehouse is one main reason why the demand for big data has grown so much — and so rapidly — in the distribution sector.”
Do you think distribution center and warehouse managers do enough to leverage big data?

by Elizabeth Hines | Mar 19, 2015 | Big Data, Blog, Data/Analytics
“[Companies] don’t know how to manage it, analyze it in ways that enhance their understanding, and then make changes in response to new insights… they don’t magically develop those competencies just because they’ve invested in high-end analytics tools.” –You May Not Need Big Data After All” Harvard Business Review, December 2013
Since the concept of big data became the buzzword du jour, big data has become big business. But a recent study by Harvard Business School suggests that many big-data investments fail to deliver because most companies can’t handle the information they already have. That’s why when it comes to big data, bigger is not always better, particularly for small to midsized companies. Lured by the promise of big payoffs, many companies have sunk millions of dollars into sophisticated data analytics software only to realize they did not have the capabilities to interpret the new insights nor the expertise to turn them into a competitive advantage. For some companies, focusing on small data often makes more sense.
It’s not hard to see why the temptation to jump headfirst into a big-data project can be strong. Giants like Amazon, Google, and Walmart showcase how an entire enterprise can be built around the interpretation of unfathomable masses of data. These companies have perfected the science of gleaning — and capitalizing on — detailed insights about customer behavior. (For example, Walmart was able to pinpoint something as specific as what kind of Pop-Tarts customers stock up on before a storm — strawberry.) With similar analytics tools now available to companies in all kinds of industries, the opportunity to turn hype into hope may be irresistible.

Companies within the logistics and supply chain industries don’t seem to be impervious to the draw of big data. In fact, a survey conducted by Supply Chain Insights found that one fourth of respondents had a big data initiative in place and 65% planned on launching one in the near future. A full seventy-six percent of survey respondents viewed big data as an opportunity. The promise of benefit from the theoretical application of big data no doubt sharpens its appeal. A supply chain company could on the demand side, for example, determine to use big data to map all the quotes and online searches that never became orders and change its marketing strategy based on a newfound understanding of how the purchase of one product leads to the purchase of another. On the supply side, big data could be used to measure the impact of a catastrophic event on suppliers abroad, and consequently, allow the company to plan in advance to mitigate the effects on American consumers. These big data benefit examples could lead to significant advantage for companies with the expertise, structure, and knowledge to collect, analyze, and draw strategy cues from large sets of raw data. Unfortunately, small and mid-sized companies usually aren’t well positioned to do so.
Start Small
Starting with small data, even if you want to eventually head into big data, is a solid strategy that will produce lasting results. To start, clearly articulate what kinds of data you want to collect and begin running a few simple analytics. Choose from which sources you’ll draw data, because randomly scanning everything between heaven and earth will do you no good. Align your goals with your business objectives and turn your analytics professionals loose on the data. If your company doesn’t have in-house analytics expertise, work to attract the appropriate talent; regardless of whether or not you have a new hire, integration and structuring of analytic personnel positions will be a more significant factor in your success than even your use of the most advanced statistical software program. Finally, spend some time determining how the findings should be presented. You’ll want them to be formatted in an understandable manner and to have a clear application for how they will improve your business.
For those of you working in small to midsized companies, what’s your take on big data? What kind of approach would make a successful small-data initiative?

by Elizabeth Hines | Feb 23, 2015 | Blog, Content Marketing, Data/Analytics, Marketing, Strategy
Measuring blogging ROI is crucial to your overall marketing success.
Just as with outbound marketing activities, your company’s inbound marketing efforts should be given the same attention when it comes to Return on Investment (ROI) analysis. In fact, companies who measure inbound marketing ROI are more than 12 times more likely to generate better year-over-year returns. And with blogging being reported as the number one method for increasing website traffic, it should stand to reason that calculating ROI for your blogging efforts is crucial to your overall inbound marketing success.
Calculating ROI for blogging activities isn’t as straightforward as say, ROI from click-to-conversion, but its achievements can be measured in other ways. Consider employing a blend of these four categories to measure the effectiveness of your blogging efforts.
Audience and Content Reach
According to a 2013 HubSpot report, 85% of marketers reported increased web traffic within seven months of beginning inbound marketing activities. While it’s true that building a successful blog can take some time, there are things you can do (and measure) to speed its maturity. Encourage engagement and reach by crafting relevant and interesting content for your audience. This increases the likelihood your content is shared and commented on by your readers.
Track this: Beyond noting any increases in web traffic, track both your average cost per view and the number of comments and social shares your blog content receives.
Lead Generation
Tying revenue directly to publishing and distributing blog content can be difficult. Thinking about blogging activities within the context of your entire sales funnel can make it easier to determine effectiveness. As blog content is typically used to attract leads, encourage readers to subscribe to your blog or submit contact info to get higher-value content. Continued engagement nurtures leads and moves them further down the sales funnel.
Track this: The cost to get a lead. You can then determine the percentage of leads that move on to become qualified leads, the percentage of qualified leads that then become opportunities, and the percentage of opportunities that are ultimately won. At the end of the day, you’ll be able to calculate the revenue generated from leads that entered the funnel from blog content.
Intangibles
What are you gaining from networking with industry peers? Has your blog played a role in developing and nurturing professional relationships? Could you consider your blogging activities as part of your professional development? Blogging provides benefits outside of traditional marketing ROI measurements. Time spent researching, networking, writing, and engaging with others in your industry should certainly be considered when determining overall usefulness of blogging.
Track this: Sales cycle times. Staying current with industry trends and building a reputation as the go-to industry expert can be reflected in the type of customers and clients you are attracting. Are you attracting more high-quality leads and closing more ideal customers? Thank your blogging activity.
Cost of Customer Acquisition (CoCA)
By understanding how much it costs your business to acquire a new customer, you gain valuable insight into how much your business should be investing on blogging activities.
Track this: Calculate your (CoCA) by dividing your cost to blog by the number of visits the blog. For example, let’s say your company spent $500 on writing a blog post and 100 people visited your site. Your Cost of Visitor Acquisition will be $5 ($500 divided by 100). If 5% of those blog visitors convert into a lead then your Cost of Lead Acquisition (CoA) is $100 ($500 divided by 5 customers). If 10% of those leads actually buy something from you, your final Cost of Customer Acquisition is $50. Investing in one blog post will yield one new customer for every $50 you invest.
While it can feel a little unwieldy to measure ROI from blogging activities, keeping a strong focus on blogging goals and objectives will help to lend weight to metrics that will ultimately matter the most to you and your business. What measures does your company use to measure ROI for blogging?
by Elizabeth Hines | Feb 4, 2015 | Blog, Data/Analytics, Marketing, Social Media, Strategy

Inbound marketing costs less than outbound marketing. And it works.
The internet has empowered customers. It has provided customers with new methods for finding and researching companies. It has also provided customers with new methods for finding, researching, and buying products.
The internet has changed marketing from a one way street to a two way street.
Customers no longer rely solely on TV/newspaper/magazine ads, billboards, direct mail, email, banner ads, and other traditional outbound marketing channels to learn about new products. These methods are now viewed as too intrusive, especially among younger consumers who regularly tune out the tactics.
Customers want to find YOU (not the other way around)
A study conducted by the Corporate Executive Board’s (CEB) Marketing Leadership Council found that the average customer progresses nearly 60 percent of the way through the purchase decision-making process before engaging with a sales rep. How are they able to do this? By going online. Customers are using websites, blogs, and social media.
A study by Pardot found that 72 percent of B2B buyers begin their research with Google. Other starting points for research: personal networks (15.58%), Yahoo (5.53%), Bing (2.76%), LinkedIn (2.51%) and social networks (2.01%).
What is inbound marketing?
Inbound marketing focuses on consumers finding you.
Inbound marketing meets your customers and prospects where they are, with the information for which they are looking, and at the right moment. Inbound marketing provides value, builds trust and authority, which ultimately result in increased leads and higher conversion rates.
The components of inbound marketing are pretty simple: Create and distribute fresh, relevant, targeted content specifically designed to reach a target audience.
Strategies include:
- Social media marketing
- Blogging and content marketing
- Podcasts
- White papers
- ebooks
- Infographics
- Search engine optimization (SEO)
- Case studies
What is outbound marketing?
In contrast, outbound marketing focuses on paying to broadcast your message to find consumers who will listen to you.
Outbound marketing is a value-driven numbers game. The more banner ads, print ads, and direct mailings you pay for, the more people see your product, and the more sales you’ll make. However, it is costly. Outbound marketing costs 38% more than inbound marketing. The average cost per lead using outbound marketing is $373. The average cost per lead using inbound marketing is $143.
Outbound marketing strategies include:
- Print ads
- TV ads
- Banner ads
- Telemarketing
- Cold calling
- Press releases
- Trade shows
- Email marketing
- Direct mail
Inbound marketing makes sense
Inbound marketing just makes sense. It is a proven methodology and it costs less. Isn’t it time to meet your customers where they are? Get online. Create content. Distribute content. Engage with customers. Optimize your website.
Fronetics Strategic Advisors is a management consulting firm focused on strategy and inbound marketing. When it comes to inbound marketing we take a different approach than other firms. This is because of our business experience and background. We know ROI is important, so our approach is data driven and produces results.
We understand that developing and implementing an inbound marketing strategy can seem daunting. We are here to help. We are happy to take a few minutes and look at your current strategy and give you ideas on how to start, or suggestions on what you can do to make your current strategy more successful. We are also happy to talk with you about what we can do.
We’d love to talk with you about how you can grow your business through inbound marketing.

by Elizabeth Hines | Dec 17, 2014 | Big Data, Blog, Data/Analytics, Internet of Things

The Internet of Things (IoT) is ubiquitous. Because of this it can seem abstruse. Puneet Mehta does a great job of putting the concept in layman’s terms: “[A] plethora of “dumb” objects becom[ing] connected, sending signals to each other and alerts to our phones, and creating mounds of “little data” on all of us that will make marketers salivate.”
The mounds of data created by the advent of the IoT does not just make marketers salivate. Gartner predicts that the IoT will add $1.9 trillion in value to the economy by 2020. Looking ahead, Cisco estimates that the IoT will create over $14 trillion in value over the next 10 years.
In 2003 there were 500 million connected devices. Cisco estimates that this number will increase to 50 billion by 2020. Morgan Stanley believes this number will be higher – it estimates there will be 75 billion IoT devices by 2020.
“Dumb” objects are becoming connected; the physical and digital worlds are converging. Mounds of data are being collected.
IoT and Big Data
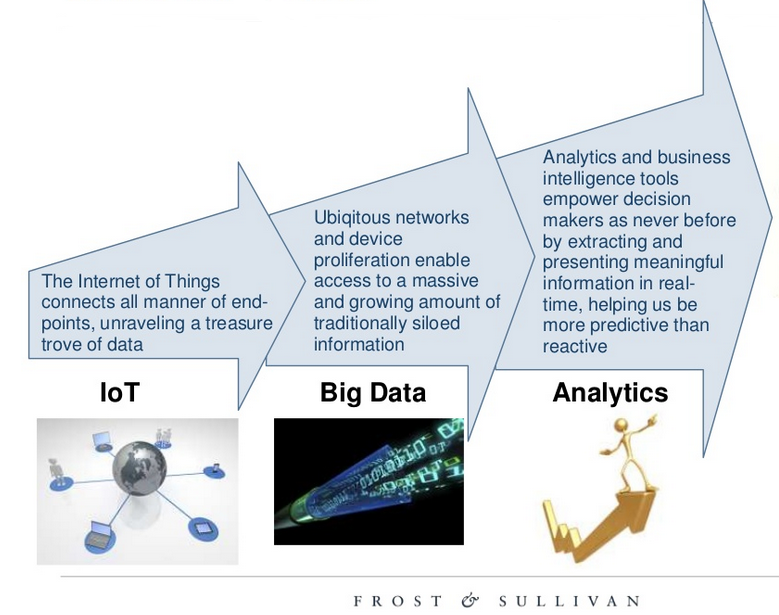
Mukul Krishna, from Frost & Sullivan, presented a simple incremental view of the relationship between the IoT and big data. In short, IoT devices can be thought of as data sources. These data sources generate an incredible amount of data – much of which was previously not accessible. The information and insights from big data allow for better decision-making.
The amount of big data created each day in 2012 was 2.5 exabytes (2.5×10¹⁸). In 2014 the amount of data were created each day was 2.3 zettabytes (2.3×10²¹),
An IDC forecast shows that the Big Data technology and services market will grow at a 27% compound annual growth rate (CAGR) to $32.4 billion through 2017 – or at about six times the growth rate of the overall information and communication technology market.
The need for a plan
McKinsey & Company offer sage advice: put a plan in place.
The payoff from joining the big-data and advanced-analytics management revolution is no longer in doubt. The tally of successful case studies continues to build, reinforcing broader research suggesting that when companies inject data and analytics deep into their operations, they can deliver productivity and profit gains that are 5 to 6 percent higher than those of the competition. The promised land of new data-driven businesses, greater transparency into how operations actually work, better predictions, and faster testing is alluring indeed.
But that doesn’t make it any easier to get from here to there.
So how does one get from here to there?
The answer, simply put, is to develop a plan. Literally. It may sound obvious, but in our experience, the missing step for most companies is spending the time required to create a simple plan for how data, analytics, frontline tools, and people come together to create business value. The power of a plan is that it provides a common language allowing senior executives, technology professionals, data scientists, and managers to discuss where the greatest returns will come from and, more important, to select the two or three places to get started.
What impact has the IoT and big data had on your company? Does your company have a plan in place?

by Elizabeth Hines | Oct 21, 2014 | Blog, Data/Analytics, Marketing, Social Media
Individuals within the logistics and supply chain industries want to learn more about social media ROI. A recent survey conducted by Fronetics found that 81 percent of respondents reported that information on proving social media ROI would be helpful to their company.
Proving social media ROI can seem impossible, but it is not if you put the right framework in place. Here’s how to put that framework in place, and prove social media ROI:
Set goals
Support your goals with SMART objectives. This allows you to track and measure your progress towards meeting your goals.
- Specific: Describe your objectives specific to the results you want. Go deeper than “gain leads” to “achieve a visitor to lead conversion rate of one percent.”
- Measurable: Metrics are essential. You can’t assess your progress towards your goal without metrics.
- Achievable: Make your goal achievable. A visit to lead conversion rate of 10 percent may not be realistic. Your goal of a visitor to lead conversion rate may be more plausible. When setting your objectives, keep reality in check.
- Realistic: As with any job, you need to have the right tools. Make sure that you have the resources, tools, and talent to meet your objectives.
- Timed: Be specific with your objective and incorporate a time frame.
Track and measure
Once you have set your goals and objectives and have identified your key metrics, put a system in place that will track and measure your metrics. At the very least, your metrics should be tracked on a monthly basis.
React
Tracking metrics is not enough. You need to react. Look at your metrics in the context of your goals and objectives. Which efforts are moving you towards your objectives and goals? Which efforts are not supporting your goals and objectives? Can these efforts be tweaked? Should you scrap them and try something new?
Taking a data driven approach is critical to proving ROI.
Wash. Rinse. Repeat.
This process is not static. When you achieve your goals and objectives, set new ones. If you are really struggling to meet your goals and objectives, you may need to revisit them to determine if they need to re-worked.
Proving social media ROI is possible. But it needs to be supported by a framework. Take the time to put a solid framework in place for your business.