
by Elizabeth Hines | Nov 13, 2017 | Blog, Consumer Electronics, Current Events, Manufacturing & Distribution, Strategy, Supply Chain
As sales and consumer desire continue to increase for drones and home assistants, the second-life market has a huge opportunity for growth.
Consumers are becoming ever-more enamored with their gadgets and toys. Drones and home assistants are becoming more ubiquitous in our homes (and flying around our skies). However, when these machines run their course — either because they break, or a newer model comes out — is there still use for them?
The market for gadgets
The marketplace for drones is an ever-growing one. Last year drone sales increased by an astounding 60%, and revenue grew to $4.5 billion. The drone market can be segmented into two categories — personal and commercial. Personal drones, which many consumers use for photography, is predicted to grow 40% this year, while commercial drones, which can be used for survey maps and delivery services, are expected to grow 60%.
While personal-use drones dominate unit sales, commercial-drone sales — which make up only about 6% of the market — are projected to represent 60% of the market’s revenue. This is due to the high cost of commercial drones, some with costs that exceed $100,000.
Home assistants are another intriguing category on the rise. These products are intended to control various devices in your home, such as thermostats, lighting, and security. These products also allow an individual to shop online using voice commands.
The frontrunner for this market has been Amazon’s Echo devices. As the primary nature of Amazon’s business is e-retail, the Echo device plays perfectly into this. By making it simple and easy to make Amazon purchases through voice command, these devices have great potential to bolster Amazon’s bottom line.
While this market is still in its early stages, Gartner Research expects tremendous growth, projecting $2.1 billion in consumer spending on personal home assistants by the year 2020.
The second-life market
So what becomes of these products as we replace them with newer models? Smart phones offer a sensible comparison when looking at the second-life market for these products. In 2016, consumers sold or traded in used cell phone devices for an average of $140 per device, generating a total of $17 billion worldwide. This selling and trading doesn’t just end after one transaction. It is predicted that at least 10% of premium ($500 and up) smartphones will have at least three users before they are retired.
We can draw a parallel about second-life potential between drones/home assistants and cell phones. Advances in technology render previous models obsolete or, at best, out of date. Consumers who can afford them will gravitate toward newer products. As with cell phones, they will generally look to recoup some of the cost for the newer product by selling or trading in the old one. These can then be sold to consumers looking for less expensive, older models. Even in the case of drones that crash, parts can be salvaged and sold to individuals that are looking to build their own drones.
The markets for these products are all still in early stages, so second-life markets are still in growth stages as well. As sales and consumer desire continue to increase for drones and home assistants, their life cycle will go on long after the first owners have moved on to newer models.
This post originally appeared on EBN Online.
Related posts:

by Elizabeth Hines | Nov 2, 2017 | Blog, Data/Analytics, Logistics, Strategy, Supply Chain
In a recent study, MIT found that companies that focus on 5 key initiatives to improve their supply chain analytics can have a big impact on their bottom line.
Some supply chain companies are leaning on the power of analytics to help streamline their processes and get ahead of their competitors. But many companies have struggled to embrace the relationship between using analytics and implementing changes that can improve business performance.
The study, published by the MIT Sloan Management Review, asked 353 participants to discuss their understanding of their companies’ analytics systems. The results showed that though most companies have an analytics system in place, very few are using the results to implement necessary changes.
Obstacles to fully utilizing analytics included inaccurate data, cost, and lack of timely data. But the benefits far outweigh the challenges. Hanesbrand Inc., for example, used predictive analytics to make changes in their inventory processes and have since seen an increase in their production and purchase orders.
So how can your company start to incorporate supply chain analytics into your company culture?
Here are 5 tips to help kick-start your analytics implementation:
1. Supply chain analytics initiatives need a top-down mandate
In order to achieve analytical success that has an influence over organizational process, it’s imperative that upper-level management use the analytical systems. Executives need to promote and utilize the systems. Buy-in from managers and team members will be seamless when it’s coming from the top. David Dittmann, director of business intelligence and analytics services at Procter & Gamble Co., stresses that “it is impossible to win over thousands of people one small analytics victory at a time. Analytics must be a top-down mandate to succeed from an organizational perspective.”
2. The simpler the model, the more likely the use
If you want your company to embrace an analytics system, it’s important that the model is simple and easy to grasp. If employees don’t understand how to use the analytics or apply the results, they won’t take the time to implement the system. The more complex a system is, the greater the potential for team members to dismiss it. The Cleo Integration Suite (CIS), for example, promotes itself as an easy-to-use platform that can integrate seamlessly into your pre-existing software. CIS understands that supply chain companies need systems that are elementary to incorporate to achieve results.
3. Business knowledge is essential
Executives in the survey noted that an in-depth understanding of business processes and their effect on the bottom line is critical to supply chain analytics success. To develop the most effective model, companies need to have insight into all of the processes that make their company successful and be able to incorporate the results into these processes. Without this foundational information, the analytics are just “fun facts.”
4. Trust in the numbers
Time is a key factor in successful analytics implementation. In order to achieve timely results, organizations have to trust in the numbers the analytics provides them. “Trust can be built through a closed-loop change management effort that is centered on performance metrics that accurately reflect the current state of the supply chain system.” writes Melissa R. Bowers, Adam G. Petrie, and Mary C. Holcomb. Once these metrics are in place, it is easy to gauge the results against past processes.
Coca-Cola Global implemented a check-and-balances system to cultivate trust in their analytics. Anytime an employee chose to override the analytics system, it gave them feedback to see if their manual adjustments resulted in an improvement or a setback, creating trust in the employees and their dependence on the data.
5. Implement mechanisms to help develop analytics professionals gain business knowledge
Many supply chain companies are hiring analytics professionals to help implement these systems into their organizations. Though experts in their field, it’s important for these trained analytics professionals to learn about all aspects of your business. This business knowledge creates an open relationship between the business and the analytics, creating more opportunities for the numbers to aid in the processes.
Out are the days of order tracking and point of sales data, and in are the days of big data and analytics. Supply chain companies are quickly realizing the need to understand and implement these analytics systems into their day-to-day processes. Creating efficiency and savings using these systems is easier than you think.
Related posts:


by Elizabeth Hines | Nov 1, 2017 | Blog, Manufacturing & Distribution, Strategy, Supply Chain
Manufacturing companies are hoping to continue their revenue growth in 2018 by focusing on 3 key areas.
KLR has released the results of its annual manufacturing industry outlook report, and the optimism following last year’s elections will continue straight through 2017.
With promises of tax reform, decreased federal regulations and looser trade agreements, manufacturers have slowly seen revenue growth throughout the U.S. markets. That growth is projected to continue into 2018.
56% of respondents expect business will continue to increase throughout the year.
And though manufacturing companies are striving to control their costs and cut back on unnecessary expenses, many companies reported increasing their marketing budgets, including technology, to invest in the future of their revenue growth.
So where is the additional money going? Manufacturing companies are investing their profits back into new products, expanding markets and breaking into new territories.
Here are the top 3 priorities for manufacturing companies in 2018.
1. Increasing share in existing markets
Over the next 12 to 18 months, 64% of the manufacturers surveyed expect their growth to come mainly from increased market share and organic growth in existing domestic markets. Manufacturing companies are looking to increase their market share through innovation, strengthening customer relationships, reliable hiring practices, and staying ahead of their competitors.
2. Seeking new markets for products and services
Manufacturing companies are trying to think outside of the box when it comes to expanding their markets. Avon got its big break when it took the now-dated approach of selling products door to door. By trying a different avenue, it was able to increase revenue without fighting for retail space with other corporate giants. Like Avon, companies are working hard to come up with innovative ways to break into untapped markets.
3. Developing new products and services in response to changing consumption patterns
Using social media platforms and other marketing tools, it’s easy for manufacturing companies to stay in touch with their customers. This engagement provides the best insight into the types of products, features and solutions your customers are looking for. Based on this crowdsourcing, or social listening, companies are able to develop products that they know will resonate with consumers and their changing needs. Though product development can be expensive and risky, incorporating customers into the conversation helps manufacturing companies minimize risk.
Despite growth throughout 2017, there are still challenges that manufacturing companies face. How are manufacturers coping with these challenges? They are adjusting their priorities and focusing on these three areas to continue growing their business and, ultimately, their sales.
Related posts:
by Elizabeth Hines | Oct 24, 2017 | Blog, Current Events, Logistics, Strategy, Supply Chain
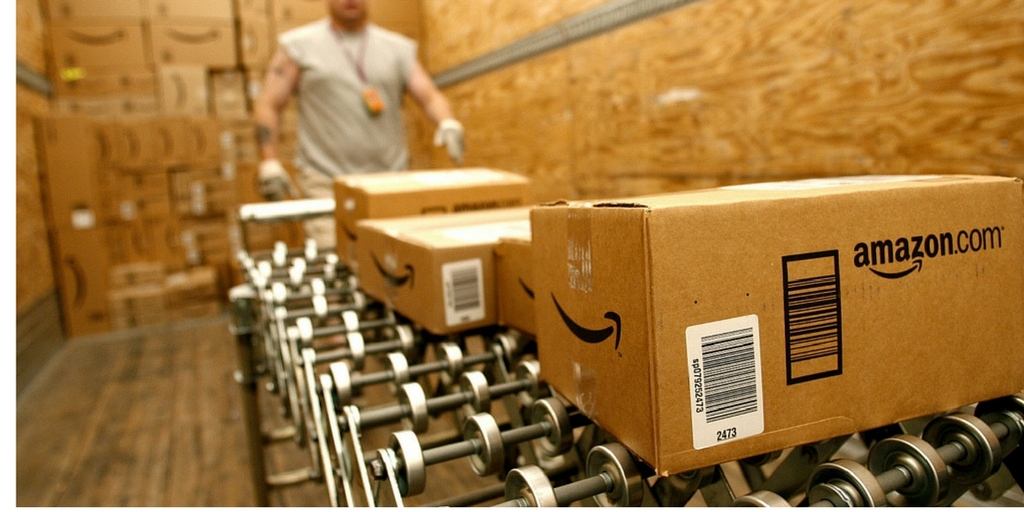
Cities should consider Amazon’s HQ2 search criteria as a roadmap for attracting innovative companies, empowering residents, and driving a healthy local economy.
We’re living through a seismic shift in the way business transactions are being conducted. E-commerce is now king. We might be tempted to think the decline of retail equates to business transactions being moved from physical space to a digital world. Will our cities and the shops that line their streets become obsolete in the face of e-commerce?
Amy Liu and Mark Muro of the Brooking Institute’s Metropolitan Policy Program contend that if Amazon’s recent search for a second headquarters (“HQ2”) has anything to show us, it’s that America’s cities still have an important role to play in the future of e-commerce.
How cities could change
Liu and Muro suggest cities take a close look at Amazon’s selection criteria for HQ2’s location and extrapolate the best ways to “build up the fundamental assets prized by innovative firms and industries.” In this way, cities can best “garner a bigger share of high-tech growth,” and furthermore, be a part of our nation’s gaining “a competitive foothold in the digital future.”
Liu and Muro draw four main takeaways from Amazon’s city selection criteria:
- Capacity to produce skilled, technical talent
- Access to domestic and global markets through modern infrastructure
- Connected and sustainable placemaking
- Culture and diversity
Cities that boast these characteristics will have the best chance at attracting the kind of companies that will shape the future of how we do business — e-commerce and beyond. These companies will employ and empower local talent. And not just highly skilled talent. I can’t help but think of this recent Wall Street Journal article about the impact that Amazon’s presence has had on Fall River, Massachusetts.
Such employment opportunities will attract new residents. New residents will boost the local economy. Strong local economies boost the health and well-being of the community. And the positive benefits snowball from there.
I’m speaking in generalizations here, but cities stand to gain quite a bit from considering Amazon’s HQ2 search criteria. Of course, there are plenty of negatives to making way for the Amazons of the world — the decline of Main Street being one of them. But if the digital world plays an increasingly important role in the ways we conduct business and commerce, isn’t there value in strategizing around it?
Related posts:


by Elizabeth Hines | Oct 23, 2017 | Blog, Current Events, Supply Chain
Consumers will spend a record $9.1 billion during Halloween 2017.
U.S. consumers will take to the retail markets Halloween 2017 and spend a whopping $9.1 billion on Halloween costumes, decorations, candy and more, making it the largest spending for the spooky holiday to date.
The National Retail Federation reports that consumers are preparing to be the baddest witches on the block, spending almost a billion more dollars this year on supplies than in 2016 ($8.4 billion). And the men are really stepping up their game, spending on average $20 more per costume than women.
“Americans are planning to spend more than ever as they gear up for Halloween,” NRF President and CEO Matthew Shay said. “Retailers are helping customers celebrate in style with a huge selection of costumes, candy and decorations to cater to ghosts and goblins of all ages.”
From 2017 blockbuster hits like Wonder Woman and Spiderman, it’s no wonder the most popular costumes for kids are superheroes. And let’s not forget about Fido — the most popular costume for pets for Halloween 2017 is a pumpkin.
Still need inspiration for the boo bash you’re attending? Try heading over to Instagram, a source of inspiration growing 12% year-over-year. Other consumers will get ideas from online search (35.2%), a retail store (30.3%), Facebook (18.2%), Pinterest (17.9%), and pop culture (17.2%).
Need more fun facts about Halloween to get you into the scary spirit? Check out this year’s infographic from the NRF’s survey.
Halloween 2017 supply chain infographic

(Made with Canva)
Have a safe and happy Halloween 2017, everyone!
Related posts:

by Jennifer Hart Yim | Oct 12, 2017 | Blog, Data/Analytics, Logistics, Strategy, Supply Chain
Shippers should be tracking these last-mile metrics to drive down the high cost of last-mile logistics.
This post comes to us from Adam Robinson of Cerasis, a top freight logistics company and truckload freight broker.
Using technology to improve last-mile metrics is essential to driving last-mile costs down, but how do shippers know if the technology is helping or hurting? The answer to this question lies in using last-mile metrics to track key performance indicators and target levels of service to ensure accountability, visibility and continued reduction of costs in last-mile delivery.
A recent survey of customer service experiences, reports DC Velocity, revealed many retailers feel current technologies do not address their customer service needs, and as few as 3 percent of retailers cite full support as part of their current systems. Unfortunately, history teaches shippers that reducing costs means cutting customer service, but integrating customer service data into delivery operations and transportation systems is key to increasing a brand’s value. In fact, 72 percent of survey respondents believe it is very important to improve access to data for in-transit shipments, which includes last-mile delivery. Essentially, shippers need to track these 11 metrics.
1. On-Time Deliveries Are King of Last-Mile Metrics
The number of on-time felt or late deliveries are more important than any other metric tracked in last-mile logistics. These metrics provide a quick yes or no analysis of the effectiveness of your last-mile logistics strategy.
2. Fuel Consumption Rates
Last-mile metrics involving fuel consumption rates can vary and depend on the preference of the company, but how fuel consumption rates are calculated can greatly influence whether a driver is saving or wasting fuel.
For example, overall fuel consumption costs may be lower, but interval-based fuel consumption rates could show consistent, stopping and starting patterns that do not coincide with existing routes and drive up fuel costs. As a result, fuel consumption rates should be calculated by averaging the total fuel costs per driver, all drivers, per delivery vehicle and per route.
3. Last-Mile Vehicle Capacity Used Versus Available
Last-mile logistics should also consider the capacity utilized against the available capacity in all last-mile delivery vans. This metric is calculated by dividing the available capacity by the total capacity. Excess available capacity rates allude to poor loading procedures or the need to consolidate routes. The same calculation is used to calculate capacity used, dividing the capacity used by total capacity.
4. Planned Versus Actual Mileage
Planned versus actual mileage last-mile metrics are calculated by dividing the actual mileage per vehicle, driver, or route by its own planned mileage. Higher actual mileage rates reveal problems with route planning or unforeseen detours to route schedules.
5. Driver Hours In-Motion and Stationary
In-motion and stationary driving hours are expenses in last-mile logistics, and, unless your company employs a fully autonomous and drone-assisted delivery network, stops are necessary. However, the amount of stops and hours of both in-motion and stationary position can help measure performance of drivers. Excess stationary hours or excess in-motion hours are calculated by dividing the total amount of time drivers spend on a route by the number of hours in motion and the number of hours stationary.
6. Cost Per Item, Per Mile, and Per Vehicle
Last-mile metrics should track the cost per item, per mile, and vehicle associated with a specific route and the company as a whole. As a result, shippers should average the total costs per item for a given route and for the company’s shipments over a set period. The same average process should apply to both mile and per vehicle metrics, too.
7. Number of Stops
Last-mile logistics and metrics should also track the number of stops per vehicle. This is important to monitoring fuel costs, but it can also allude to poor route optimization practices. In other words, vehicles with a high number of stops should be reevaluated for ways to improve route schedules.
8. Average Service Time
The average service time metric can be complicated because it involves different data to calculate, depending on the source of an order. Most commonly, it is calculated by dividing the total service time at the store by the total number of deliveries. In other words, what is the average amount of time spent per order between the store, the warehouse, and other pre-shipping processes?
9. Customer Complaints
The need to manage customer service and address customer complaints leads to another metric in last-mile logistics, reports Talking Points With Adrian Gonzalez. What is the total number of customer complaints, and how do they stack up against the total number of deliveries? This metric is calculated by dividing the total number of deliveries by the total number of complaints received.
10. Order Accuracy
Order accuracy is calculated by comparing the known inaccuracies of orders against all shipped orders. Since some consumers may never report inaccurate orders, it is difficult to track a specific order inaccuracy metric. Instead, shippers should track order accuracy rates by dividing the total number of shipped orders by the number of orders not subject to customer service disputes, calls or complaints.
11. Damage Claims
A final last-mile metric to track is also about problems with orders: damage claims. Shippers should track the number of incoming damage claims against the total number of shipments. This is calculated by dividing the number of damaged claims by the total number of shipments. The resulting value is the percentage of damage claims in decimal form.
Using Metrics, Shippers Can Improve Last-Mile Logistics
Metrics allow shippers to understand the ins and outs of last-mile logistics, and metrics provide a means of measuring the performance of last-mile logistics plans against actual processes and their associated costs. As a result, shippers can make changes to their operations to improve last-mile services through last-mile metrics, and knowing more about last-mile needs is key to providing more than just the standard last-mile delivery options.
Related posts: