Infographic: Holiday Supply Chain 2018
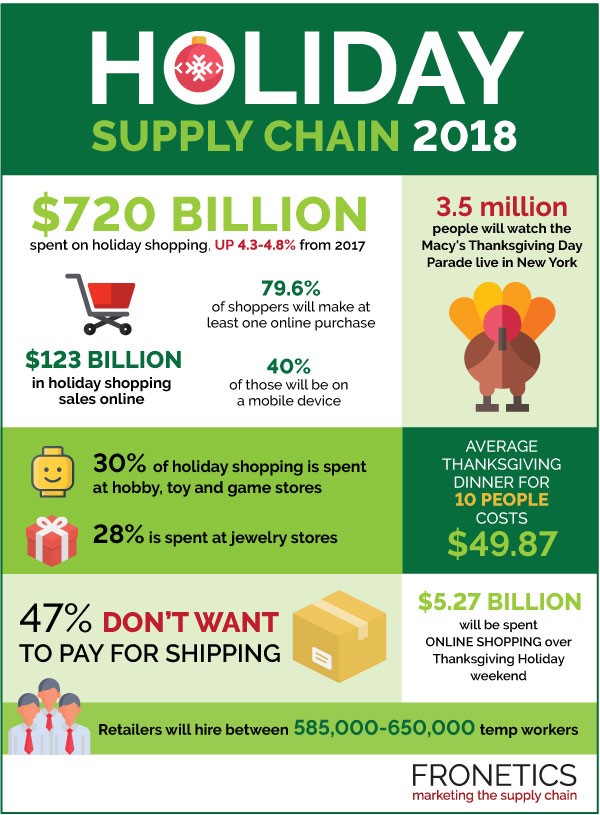
With the 2018 holidays approaching fast, customers are pulling out their wallets and getting ready to increase holiday spending by at least 4.3%.
The National Retail Federation (NRF) is estimating that holiday sales will be up 4.3-4.8% over 2017, for a total of $717.45 billion to $720.89 billion. “Thanks to a healthy economy and strong consumer confidence, we believe that this holiday season will continue to reflect the growth we’ve seen over the past year,” says NRF President and CEO Matthew Shay.
[bctt tweet=”The National Retail Federation (NRF) is estimating that holiday sales will be up 4.3-4.8% over 2017, for a total of $717.45 billion to $720.89 billion.” username=”Fronetics”]
Shopping insights
Consumers are planning to spend an average total of $1,007 for decorations, candy, and gifts ($853 on average), as well as other purchases for themselves and their families ($154 on average). This is an increase from 2017, continuing the trend of growth over the past 5 years.
Not only are they spending more, but consumers are starting early this year—as many as 40% will have started their holiday shopping by November 1, and 18% got started in September or earlier.With Black Friday and Cyber Monday behind us, consumers have been using deals and promotions to start getting items on their holiday lists. 164.6 million shopped or considered shopping during the Thanksgiving holiday weekend.
Increasingly, shoppers are turning online, many on mobile devices. 71% are planning to use a smartphone or tablet to research or make a purchase. In fact, 55% of consumers are planning to shop online. Of those, 94% plan to take advantage of free shipping, 50% plan to buy online and pick up in store, and 16% plan to splurge on expedited shipping.
Priorities
Holiday shoppers rank sales and price discounts (71%), quality (60%), selection of merchandise (60%), and free shipping (47%) as the top factors in deciding where to shop this year.
“Consumers will be scouring through retailers’ ads to make sure they are getting the best deal possible,” Prosper Insights Executive Vice President of Strategy Phil Rist said. “Although sales will remain an important factor, shoppers want good quality and want to be able to find what they’re looking for.”
Related posts:


