by Fronetics | Jun 20, 2019 | Blog, Content Marketing, Logistics, Marketing, Social Media, Supply Chain
Participating in social media is increasingly important for businesses in the supply chain. Here are the 3 steps to proving social media ROI.
Highlights:
- It may seem obvious, but too many businesses approach social media marketing with vague goals or none at all.
- Once you’ve set your goals and identified your key metrics, it’s time to implement a system that will track and measure your metrics.
- Once you’ve calculated ROI for your social media platforms, it’s time to think strategically about optimizing your content marketing resources in terms of allocation and timing.
Video transcript:
I’m Elizabeth Hines, Creative Director at Fronetics, and today we’re talking about three steps to prove social media ROI.
Participating in social media is increasingly important for businesses in the supply chain. But many clients tell us they have a hard time getting approval for the expense because it’s notoriously difficult to measure the return on investment.
Well it’s true that many of the benefits of social media — like greater brand awareness and improved communication with customers — are difficult to quantify, there are some ways to prove the ROI of your participation in social media.
Here are the 3 steps to proving social media ROI:
1. Set goals
I’m not talking “grow your business” or other vague benchmarks like that. I mean “increase web traffic from social by 10% over the next 90 days.” Really specific benchmarks and goals are important in measuring success.
2. Track and measure
Make sure you have means to accurately measure how you’re doing against your goals. All the social platforms have excellent analytics tools to help with this. We also use tools like Google Analytics and HubSpot.
3. React
Look at your metrics in the context of your goals. Once you figure out what’s helping you meet those objectives and where you’re falling short, you can tweak your efforts to be more successful and to make sure that you’re actually achieving your ROI.
For more information on social media and all things digital marketing, visit our website at Fronetics.com
Related posts:

by Fronetics | Jun 11, 2019 | Blog, Content Marketing, Logistics, Marketing, Social Media, Supply Chain
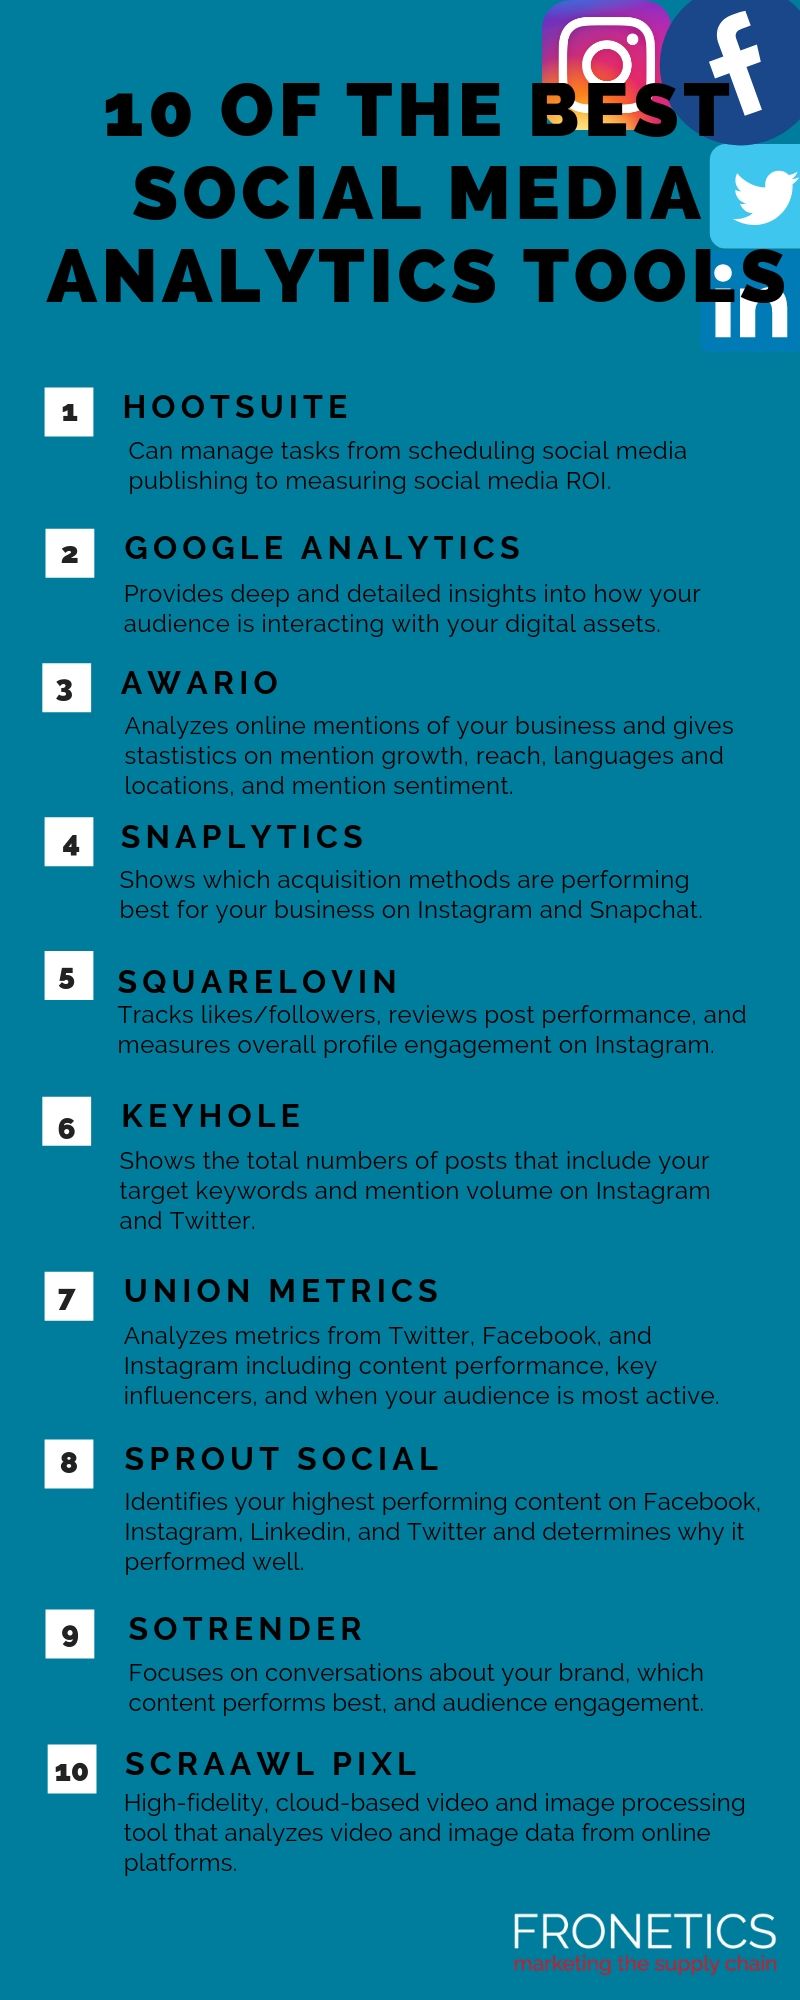
An effective social media strategy requires data. Here are our 10 favorite social media analytics tools to empower you with insights that will boost your social media game.
Highlights:
- Hootsuite and Sprout Social are all-around social media management tools that offer analytics.
- Google Analytics is an overall powerhouse tool to track the performance of all your digital assets.
- Newcomers to the list include Awario, Squarelovin, Keyhole, and image analytics tool PixL.
At Fronetics, we believe in a data-driven approach to digital marketing. A solid analytical framework has the potential to offer insights that will shape and refine your strategies, increasing your ability to generate, nurture, and convert leads. We’ve pulled together 10 of the best social media analytics tools to help you determine what’s working and what’s not — and to empower you to develop a data-driven strategy.
Our 10 favorite social media analytics tools
(Made with Canva)
1) Hootsuite
There are so many tools out there, and our internal list of the best social media analytics tools often shifts. But there are a few platforms that always make the list, and Hootsuite is one of them. It’s one of the most popular social media management tools for a reason – it’s a powerhouse that can manage tasks from scheduling social media publishing to measuring social media ROI.
Hootsuite gives you key metrics from Twitter, Facebook, and Instagram with audience and post insights, as well as performance data. It packages all the data in approachable charts and graphs. One of our favorite features is the AutoSchedule tool, which lets Hootsuite determine the optimal time to post or tweet based on when similar content performed well in the past.
2) Google Analytics
Another of our perennial favorites, Google Analytics is a robust platform that can provide deep and detailed insights into how your audience is interacting with your digital assets, including social media. This is one of the best social media analytics tools out there, and we’ve written extensively about how to get the most out of it.
For social media analytics, we particularly recommend three custom reports: Best Days to Post on Social Media, Best Time to Post on Social Media, and the Social Media Traffic by Date and Hour. These three reports offer real-time data, along with the in-depth insight you need to help your business optimize its social media strategy.
3) Awario
Awario analyzes online mentions of your business and gives you statistics on mention growth, reach, mentions’ languages and locations, mention sentiment, and where on the web mentions are occurring. We particularly appreciate that the tool also identifies social media users who have used your keywords and provides you with a list of social media influencers in your specific area.
Benchmarking your social media marketing strategy against your competitors is key to understanding how you’re doing. Awario lets you create alerts for your main competitors and offers you a step-by-step comparison of your social media performance against theirs.
4) Snaplytics
While all-inclusive tools like Hootsuite and Google Analytics are excellent for evaluating your overall social media strategy, we also recommend a few tools that focus on specific platforms. Snaplytics hones in on Instagram and Snapchat, including offering insights on Instagram Stories.
For both networks, Snaplytics shows you which acquisition methods are performing best for your business, as well as what precipitates rises and falls in engagement levels. Snapchat can be a tricky platform for brands, and Snaplytics provides the kinds of insights you need to make inroads on this millennial-dominated network.
5) Squarelovin
We’ve written extensively about how supply chain companies can make the most of Instagram and Instagram Stories. Squarelovin is an analytics tool specifically for Instagram that provides you with the data you need to optimize your strategy. It tracks likes and followers, reviews post performance, and measures overall profile engagement.
One of the best social media analytics tools for Instagram out there, Squarelovin highlights the best times to post, ideal filters to use, and most popular hashtags. It also gives you a history of engagement with your posts, broken down by hour.
6) Keyhole
This social media monitoring tool offers up deep analytics for Twitter and Instagram. Keyhole will show you the total number of posts that include your target keywords, as well as how mention volume has changed over time. It displays engagement data, hashtag usage trends, sentiment metrics, and reach statistics.
Influencers are key on Instagram and Twitter, and influencer marketing should be part of your social media strategy. Keyhole provides insights into influencers and trends in your specific niche, along with audience demographics and locations.
7) Union Metrics
Union Metrics analyzes a range of metrics from Twitter, Facebook, and Instagram. Like Hootsuite, it lets you know which content is performing best across each platform, the times when your audience is most active throughout the day, and who your key influencers are.
What really sets Union Metrics apart is in its potential for optimizing content creation. The tool goes above and beyond by tracking relevant trends to help you generate ideas for new content, based on hard performance data.
8) Sprout Social
Sprout Social is probably Hootsuite’s biggest competitor, and it’s another of our frequent favorites. Like Hootsuite, it’s an all-around social media management tool that provides key analytics as well. It measures performance and engagement across Facebook, Instagram, LinkedIn, and Twitter and benchmarks your data against competitors.
Sprout Social also helps you identify your highest performing content and determine why it has performed well. It can also show you how your paid ads are performing through a comparison of paid versus organic impressions and followers gained.
9) Sotrender
This formidable social media analytics tool shows you where conversations about your brand are happening, which of your content performs best, and how your audience engages with your social media content. Sotrender analyzes Twitter, YouTube, Facebook, and Instagram and makes it easy for you to benchmark your efforts against your competitors.
We like any tool that not only offers data but gives you advice for improving your strategy. Sotrender offers customized tips on where your marketing strategy needs improvement, based on the analysis it performs.
10) Scraawl PixL
As the internet, and social media in particular, becomes more visual, experts have pointed to a dearth of analytics tools with the capability to perform rich analysis on images. Scraawl PixL is a relatively new kid on the block, and it’s attempting to fill the void when it comes to image-based analytics.
This high-fidelity, cloud-based video and image processing exploitation tool offers an easy-to-use interface, as well as workflows for analyzing video and image data from online digital platforms. It relies on machine learning-based algorithms that enable face detection and recognition as well as object detection, tracking, and classification.
What are your favorite social media analytics tools?
Related Posts:

by Fronetics | May 29, 2019 | Blog, Content Marketing, Data/Analytics, Marketing
These Google Analytics reports are crucial to understanding the visitors who are browsing your website and how you are more likely to get them to convert.
Highlights:
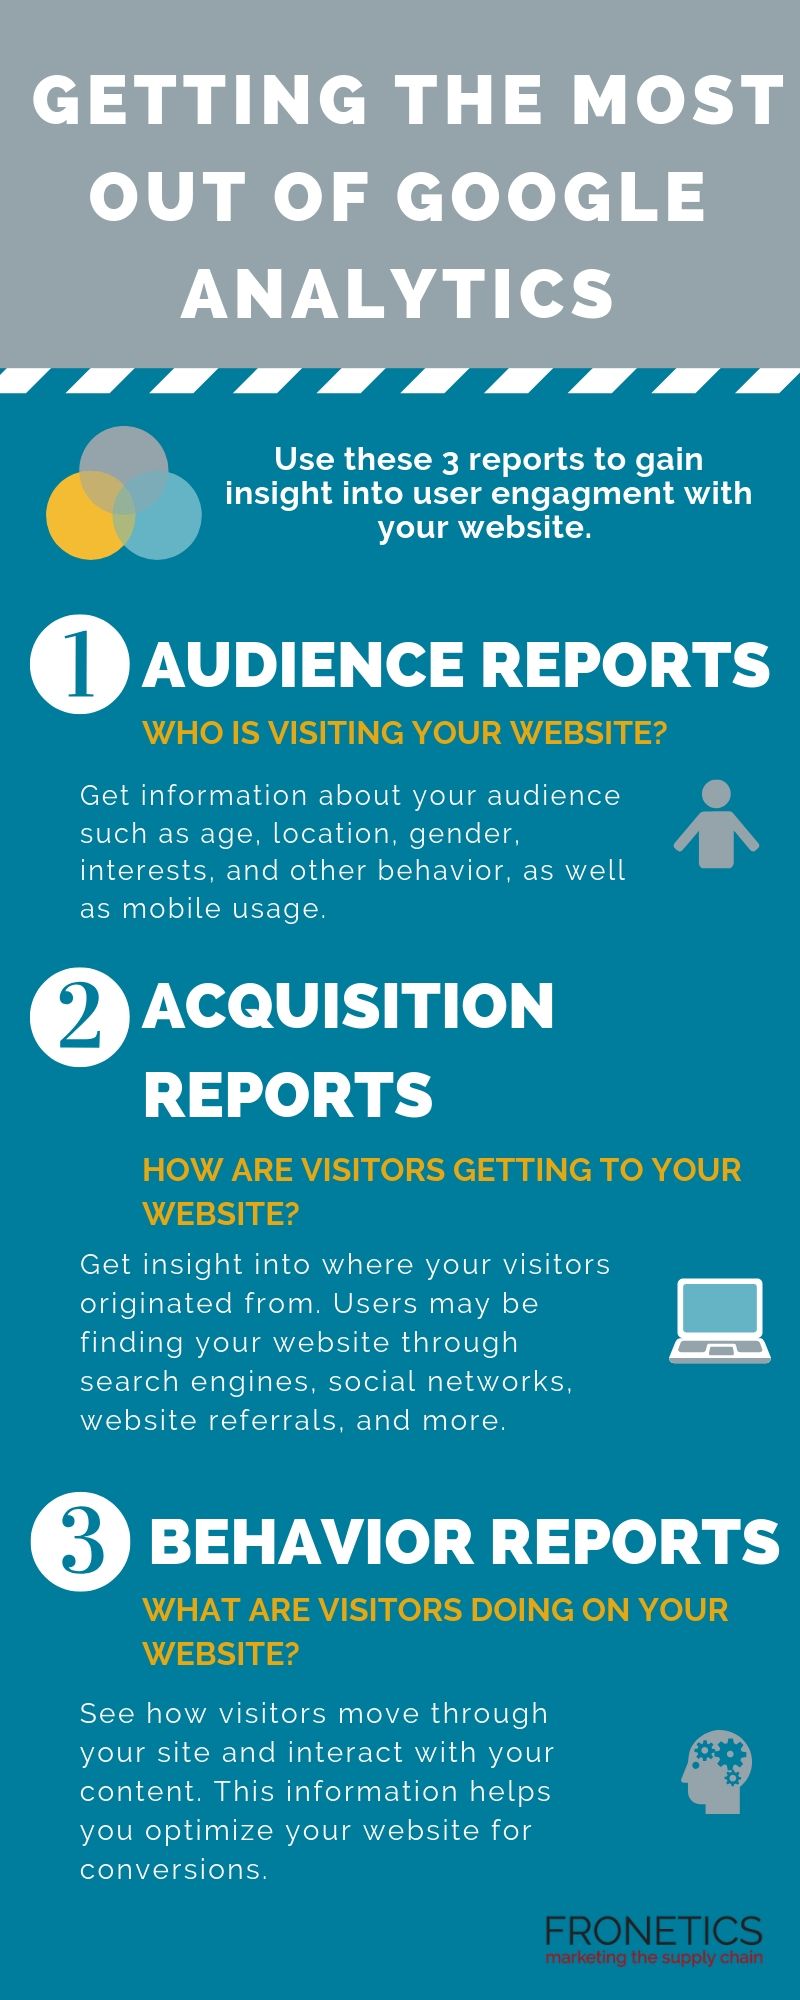
- Audience reports tell you who is visiting your website.
- Acquisition reports convey how are users getting to your website.
- Behavior reports show what visitors are doing on your website.
(Made with Canva)
Your website is your best opportunity to convert digital prospects into leads. But how can you learn who is browsing your website and what they are doing while they’re there? Most importantly, how can you get more of them to convert? Here’s where tools like Google Analytics can help.
Google Analytics is one of if not THE most comprehensive analytics tools available to digital marketers. But it can be very overwhelming if you don’t know how to navigate it. So, we’ve come up with the 3 Google Analytics reports you should be running if you want to understand how to get more visitors to convert on your website.
But, first, let’s start with the basics.
Understanding Google Analytics
At a fundamental level, Google Analytics helps you understand and make decisions based on the traffic that comes to your website. This free tool is a powerhouse that uses a JavaScript code to collect data surrounding how users interact with your website. It then processes that data and generates customizable reports for you within the platform.
[bctt tweet=”This free tool is a powerhouse that uses a JavaScript code to collect data surrounding how users interact with your website. It then processes that data and generates customizable reports for you within the platform.” username=”Fronetics”]
I should say: the data you gain from Google Analytics is all the richer if you begin by setting up Goals on the platform. This way, Google Analytics can go to work for you, measuring how well your website is fulfilling your specific objectives. If you start by properly setting and configuring your goals, Google Analytics can provide you with critical information that’s specific to your strategy. Of course, you can always add to or adjust your goals, as you collect data.
Getting the most out of Google Analytics can empower you to make improvements to your website based on the data it collects for you. The more information you have about your site and its traffic, the more you can make adjustments to meet your objectives. Furthermore, the insights you gain from your metrics can help shape future objectives, to improve user experience on your site.
3 Google Analytics reports that are key to getting the most out of the platform
Using Google Analytics, you can gain insight into some of the most important questions surrounding user engagement with your website. In particular, these 3 reports are helpful in getting the most useful data for understanding lead conversion opportunities:
- Audience reports: Who is visiting your website?
- Acquisition reports: How are users getting to your website?
- Behavior reports: What are website visitors doing on your website?
Here’s what you need to know about each report.
1) Audience reports
As you create and publish content on your website, you need to know who’s reading/watching/viewing/listening to it. With Google Analytics, you can get information about your audience such as age, location, gender, interests, and other behavior.
As users are increasingly engaging with websites on mobile devices, we often encourage clients to monitor the Mobile report as well as other audience demographics. This report shows you what percentage of your audience comes from a mobile device, as compared to a desktop or tablet. You need this information, particularly because mobile device users tend to have different behavior and goals from those on desktops. If your traffic is heavily mobile, your site needs to be optimized for these visitors.
We also encourage clients to make use of Google Analytics’ audience benchmarking reports. These reports allow you to compare your results with aggregated industry data, giving you the context you need to set targets. Benchmarking can also give you insights into industry-wide trends and help you determine how you’re doing as compared to your competitors.
2) Acquisition reports
Knowing how visitors are getting to your website will empower you not only to improve your site, but to make strategic decisions surrounding your other digital channels. Google Analytics offers acquisition reports that provide insight into where your visitors originated from. Users may be finding your website through search engines, social networks, website referrals, and more.
Use the Acquisition Overview to get a quick overview of the top channels that are funneling visitors to your website. You can also see associated acquisition, behavior, and conversion details for each of these channels. If you have your Google Analytics Goals in place, the Acquisitions Overview report will display how well each channel is driving conversions.
Next, take a deeper dive in the Channels section, which gives you rich information about each of your channels. For example, if you click on the “Organic Search” channels, Google Analytics takes you to the Keywords report, which lets you know how you’re faring with specific search queries. Clicking the “Direct” channel will take you to the top landing pages for direct site visitors, and “Social” shows you your top-referring social networks.
3) Behavior reports
Once visitors are on your site, what are they doing there? If you’re getting the most out of Google Analytics, you can see how visitors move through your site and interact with your content – and, in turn, you can be strategic about optimizing your website for conversions.
Start with the Behavior Overview. Here, you’ll find a graph of the amount of traffic your website receives, as well as additional metrics such as Pageviews, Average Time on Page, Bounce Rate, and more.
For more insight, the Behavior Flow report shows you the path users typically take on your website. You can see the first page they view, all the way to the final page they typically visit before exiting your site. Here, you’re getting a visual of how long visitors stay on your website — and learn a bit about why they leave.
The bottom line: Google Analytics reports help you optimize your website
Data empowers you to make informed decisions and tailor your strategies to meet your objectives. Not only that, data can help you determine your objectives in the first place. Google Analytics is perhaps the most robust tool out there for gathering information and insights into essentially every aspect of your website. Make sure you’re making use of it.
What Google Analytics reports have you found most helpful?
Related posts:

by Fronetics | May 21, 2019 | Blog, Content Marketing, Data/Analytics, Logistics, Marketing, Supply Chain
Supply chain companies are increasingly recognizing the need to align sales and marketing teams through the use of analytics.
Highlights:
- Sales and marketing alignment can be aided by analytics tools.
- A content audit can ensure sales has relevant material for every stage of the buyer’s journey.
- Digital Asset Management Software acts as a unified repository for content and analytics data.
Often, when we first talk to prospects about digital marketing, their sales teams start to get the jitters. There’s a big misperception out there that inbound marketing is bound to make sales teams obsolete – but this couldn’t be further from the truth. In fact, when companies take steps to align sales and marketing teams, their efforts start to pay off in big ways.
We’ve written a lot about how to align sales and marketing, as well as the dangers that crop up when companies haven’t synchronized these departments. That’s not to say that it’s an easy task. In fact, HubSpot’s 2018 State of Inbound report found that a mere 22% of companies report that their sales and marketing relationship is tightly aligned. Increasingly, supply chain companies are finding success using analytics tools to meet the challenges of aligning sales and marketing teams.
Understand your target audience
If you’re on the marketing side, you probably have a picture of your target audience, including multiple specific buyer personae. But how familiar is your sales team with this information? Chances are, sales has knowledge about your target audience that is based as much on experience as it is on the goals your marketing department created.
If the lines of communication aren’t clear when it comes to understanding your target audience, you’re shortchanging both marketing and sales. The sales department needs clear and complete communication from marketing about the type of buyers being targeted. Meanwhile, the knowledge that sales personnel will have accrued from their on-the-ground experience can help shape future marketing efforts.
To align sales and marketing in their understanding of your target audience, web analytics tools like Google Analytics are extremely beneficial. Use analytics to track user interaction with all your digital assets and build accurate personae that are data-driven. Ideally, analytics can validate and enhance the knowledge that sales teams have built.
Align sales and marketing with content that enables sales in a digital space
One of the most frequent complaints sales teams voice is that they lack relevant materials from marketing. And on the other side of the coin, marketing departments often report that sales teams aren’t clear about their needs, nor do they use the materials they’ve provided.
To get everyone on the same page, perform a content audit to determine which of your existing content matches with each target buyer persona, as well as what content will be most useful to your sales team at each stage of the buyer’s journey. Next, put some analytics in place. You need to know how your content is performing not just from a lead-generation perspective, but from the standpoint of closing deals.
To help you develop a process for evaluating the success of your content and soliciting and incorporating feedback from sales, Digital Asset Management Software is a great resource. Tools like Canto or Bynder can be a synchronized, discoverable repository of marketing assets and their function for sales, as well as help you keep track of your analytics.
Final thoughts
As supply chain companies are increasingly recognizing the need for sales and marketing teams that work in tight alignment, analytics are an invaluable resource for synchronizing efforts across departments. And the possibilities are continuing to expand for what analytics, including artificial intelligence, can do.
Keeping the lines of communication open, and sharing analytics data will help lead to accurate, data-driven buyer personas and an optimally functioning sales team.
Related posts:


by Fronetics | May 7, 2019 | Blog, Content Marketing, Logistics, Marketing, Social Media, Supply Chain
When it comes to social media, timing is everything. These 5 tools will help you determine the best time to post on social media for your business.
Highlights:
- Social media is playing an increasing role in B2B purchasing decisions.
- Even if you’re posting great content, if you’re doing it at the wrong times, you’re losing out.
- Social media management tools can help you understand your audience and make informed decisions about post timing.
If you’re a B2B marketer, chances are, you’re well aware of the importance of social media. But since, as BuzzFeed’s Jonathan Perelman famously put it, “Content is king, but distribution is queen, and she wears the pants,” simply posting your content is only half the battle. Knowing the best time to post on social media is nearly as important as what you post.
It’s difficult to overstate importance of an effective social media strategy. Not only do 78% of marketers who have used social media for 2 years or more report increased traffic to their websites, but B2B decision-makers increasingly report that they are influenced by social media when purchasing. According to Demand Gen’s 2018 B2B Buyers Survey Report, more than half (54%) of all B2B buyers rely on social media to research vendor solutions.
[bctt tweet=”Not only do 78% of marketers who have used social media for 2 years or more report increased traffic to their websites, but B2B decision-makers increasingly report that they are influenced by social media when purchasing.” username=”Fronetics”]
These are powerful numbers, and all signs point to social media playing an ever-increasing role in the B2B buyer’s journey. For your social media content to pack the biggest punch, you need to be posting at the optimal times. Luckily, there are a plethora of social media management tools that can help you refine your strategy. Here are our 5 favorite tools for determining the best time to post on social media for B2B brands.
5 tools for determining the best time to post on social media
1) Google Analytics
This robust analytical tool is among the most popular all-around web tools for B2B businesses, and for good reason. Google Analytics can help you determine how your audience is interacting with all your digital assets, and it offers some great insights about social media in particular. You can create various types of custom reports based on your business’ goals and results. We recommend three in particular to help you find the best time to post on social media:
- Best Days to Post on Social Media
- Best Time to Post on Social Network by Hour
- Social Media Traffic by Date and Hour
2) Buffer
A company with an impressive record when it comes to social media management, Buffer’s platform lets you easily manage all your social media platforms. Like its biggest rival, Hootsuite (more on that soon), Buffer offers among its features some useful insights for determining ideal post timing and frequency. For example, it analyzes follower activity and suggests the perfect moments to post on each social media platform.
3) Hootsuite
Hootsuite has been one of our favorite tools for a long time, and it truly offers a rich variety of features and insights to maximize the effectiveness of your digital assets. Not only is it effective at scheduling social media posts, it’s an excellent tool for measuring social media ROI — no easy task! Hootsuite’s AutoSchedule feature is one of its best assets. For each piece of content you plan to post on social media, it analyzes when similar content performed best in the past and determines the optimal post time. In addition, it considers the platform and publishes based on audience engagement on each network.
4) Followerwonk
Followerwonk is new to our list, and it’s different from most social media management tools. While it doesn’t offer the kind of scheduling and management features as the other platforms on our list, what it does do extremely well is help you gain valuable insights and understanding of your audience. For example, Followerwonk lets you analyze your current Twitter followers by things like location, post timing, engagement, accounts they follow, and more, as well as contrast those relationships with your competitors. Understanding your followers at this level will not only help you determine when your business should post on social media, but will allow you to analyze and adjust your strategy in all kinds of ways.
5) SproutSocial
Another perennial favorite, SproutSocial offers the whole menu of social media management tools: everything from monitoring to scheduling to analytics. The customized dashboard gives you a bird’s eye overview of how your social media channels are performing. You can find deeper insights, including individual statistics on each post, and customer data like gender, age, and location demographics. The platform’s ViralPost technology boasts impressive results at finding the best time to share your content.
Figuring out the best time to post on social media for your business is no easy task, but it’s key to getting your content to reach your target audience. There’s no one-size-fits-all solution, and any one, or a combination, of these tools can help you understand your audience better and get your content out to them at the right times.
Related posts:
