by Fronetics | Aug 10, 2016 | Blog, Content Marketing, Data/Analytics, Marketing, Strategy

Examine these stats when you analyze your content to improve your content strategy and the effectiveness of future content.
A critical (but often overlooked) element of an effective inbound marketing strategy follows the actual production and distribution of content: analyzing your content. It sounds obvious, but many businesses who are producing content do not take the time — or are unsure how — to evaluate how it has performed over time.
Regularly studying how your blog posts, videos, high-value resources (e.g., case studies), and other content resonates with your audience helps inform your strategy. It tells you what kinds of content succeeds in driving traffic and converting leads, as well as which distribution platforms and patterns are optimal.
While you may have had a good feel for this when you initially developed your strategy — p.s. you should always have a strategy and you should always document it — an audit can confirm it. If it doesn’t, you can make adjustments.
Also, keep in mind that digital and social media is constantly evolving. Regular content analysis will dictate where and how you need to accommodate changing user patterns, interests, behaviors, and technologies.
Here are four things that are important to evaluate when you analyze your content.
1) Views
How many times your content has been read, watched, or downloaded is a good indicator of how well it resonates with your audience. It’s important to evaluate individual pieces of content (rather than total website views) so you’ll know exactly what is driving web traffic.
Run such reports on a regular basis, examining how your content has performed over that short interval of time. You’ll want to consider how certain subjects play during the time of publication. You should also keep an eye out for how things have changed over time — for example, a topic that normally drives a lot of traffic that is no longer getting the same attention. Has audience interest changed or been satiated? Is the distribution platform no longer appropriate for that topic?
For blog posts or web pages, make sure to check both pageviews and unique pageviews, as well as bounce rate and time on page. That way, you can rule out any spam traffic or pages that draw a large audience but do not end up keeping them once they start reading. An eye-catching title or well-optimized post can bring the horse to water, but if it’s not drinking, your content isn’t doing its job.
2) Performance over time
It’s equally important to check how individual content has performed over its lifetime.
You may have a blog post that gets an extraordinary number of views the week it is posted but then fails to draw traffic thereafter. If that’s the case, examine what circumstances were in place at the time of the post and how the post fit in that context, then try to replicate that pattern in the future.
On the other hand, if you have a post that continues to draw traffic long after it has been posted, take note. Is content involving similar topics popular as well? Your audience is hungry for information about that subject. Consider other factors: Was it authored by a particular company leader? Is it formatted in a certain way, or did you use certain keywords?
3) Social impact
What kind of content gets the most engagement on social media? Examining the number of likes, shares, comments, and click-throughs on individual posts offers insight into what your followers are interested in. It can also help you evaluate your distribution strategy. Do certain subjects perform better at different times of the day? Get more engagement on one platform? Use individual channel’s analytics features as well as tools like Google Analytics to evaluate the impact of your content on social media.
4) Lead conversion
The reason we create and publish content is to attract new business, so knowing what drives lead generation and conversion is incredibly valuable. If you use marketing software, like HubSpot, this is easier to do. If not, it can be difficult, though not impossible, to understand what content was critical in winning over your customers.
Related posts:

by Fronetics | Jul 19, 2016 | Blog, Content Marketing, Data/Analytics, Marketing, Social Media

This is part three of a three-part series on Twitter for B2B. See part one, Twitter for B2B, and part two, Tweet This: 20 Ideas for Twitter Content for the Supply Chain.
Leverage insights from Twitter’s analytics dashboard to improve audience engagement, reach, and content development.
Twitter is among the most popular social media platforms for companies in the logistics and supply chain industries. In fact, 95% report that Twitter is somewhat or very impactful on business. Yet 81% say that information on tracking and measuring ROI would be helpful to their business’ use of social media.
Fortunately, Twitter offers users a free tool that details how your tweets are performing and what your audience is interested in. In fact, Twitter Analytics can help you better understand your followers and refine your Twitter strategy to increase your engagement.
Here are the basic features of Twitter Analytics that you need to know.
Account home
Your account homepage offers a high-level overview of your Twitter activity in the last 28 days as compared to the previous period. This dashboard also provides information about your activity in the current month, including:
- Total tweets, impressions, profile visits, new followers, and mentions
- Your top follower, who has the most reach in your network each month
- Which tweet mentioning your name (“mention”) had the most engagement
Scroll down to see the same details for previous months.
Tweet activity
This dashboard provides metrics for each tweet in the last 28 days. You can see impressions, engagement, and engagement rate by tweet. Click on an individual tweet to get the details on engagement broken down by likes, link clicks, retweets, or replies. You can also see the day-by-day breakdown of total lkes, link clicks, retweets, and replies.
Audience insights
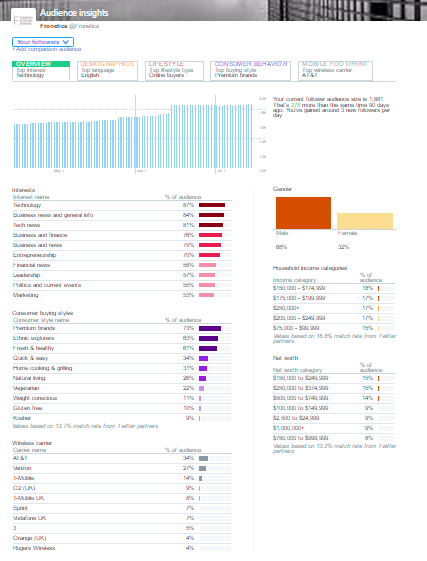
This is one of the most useful dashboards for insight on your followers, their behaviors, and interests. Smart marketers can use this information to better understand the kinds of content that resonates best with their audience.
The dashboard is broken down into 5 tabs:
1) Overview
See how your audience has grown over time, as well as gender breakdown, household income and net worth. Other features include:
- Interests (e.g., technology, politics, financial news, etc.)
- Consumer buying style (e.g., premium brands, gluten-free, healthy living, etc.)
- Wireless carrier

2) Audience demographics
This tab tell you about:
- Gender
- Country and region
- Language
- Household income, net worth, and home value
3) Lifestyle
Get insight into your followers regarding:
4) Consumer behavior
Learn about your followers’ buying styles:
- Aftermarket auto buyer type (including the last time they purchased a vehicle)
- Consumer buying style
- Consumer goods purchases
5) Mobile footprint
Discover information about your followers’ mobile behaviors:
- Wireless carrier
- Device categories (device type) and mobile/desktop breakdown
In addition to seeing this information for your followers, you can also filter by organic audience and the entire Twitter community to compare.
Events
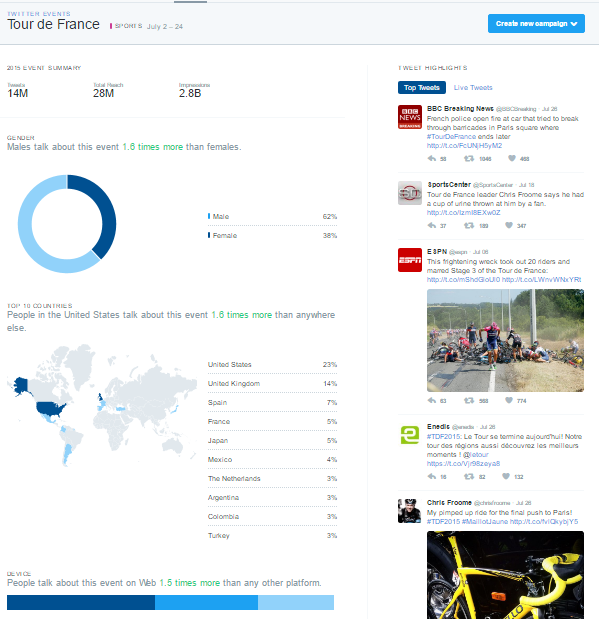
Events gives you insights into how the Twitter community is discussing certain events or trends, like the Republican National Convention, Tour de France, Independence Day: Resurgence, or Throwback Thursday. Click on an event to learn about the audience that’s engaging in conversation about that topic.

Videos
The videos dashboard collects metrics on your video content. In addition to views, learn how long users are watching your videos and where users stop watching.
Twitter cards
Twitter cards allow you to include rich media in your tweets, and this dashboard helps you track how that content is being shared. You can view the following features:
- Snapshot: An overview of how your content is performing on Twitter
- Change over time
- Sources: The most popular platforms from which users send tweets linking to your content (e.g., TweetDeck, Twitter for iPhone)
- Best practices: Personalized tips for improving your content’s performance
Campaign dashboard
If you are using Twitter Ads, the campaign dashboard allows you to track the results of your ad campaigns. Check how your ads are performing in terms of:
- Impressions: This is how many times your ads have been seen by Twitter users.
- Results: These are the actions that are tied to your objectives. For example, if your goal is website visits, the results tracked will be link clicks.
- Engagement rate: This is the number of impressions for your ads, divided by the number of results.
- Cost per result: This is how much you’re paying, on average, for each relevant action people are taking from your ads.
You can see these results across all campaigns, or segmented by:
- Your different objectives: See the average results for your website clicks campaigns, or the average results for your followers’ campaigns.
- Individual campaigns: See how specific campaigns are performing against your goals.
- Individual tweets: See which combinations of copy and creative are contributing the most to your campaigns.
- Targeting criteria: See which of your targeted audiences are responding the most to your ads.
Other features
Conversion tracking
Set up conversion tracking to follow what happens after users view your ads. This way, when users click on one of your links, retweet, like, or simply see your tweet and then go to your site, you’ll know where they came from.
Get high-performing tweets in front of a larger audience with Quick promote. Choose your tweet; click “Promote;” target a location (worldwide, country, state/province/region or metro area); and select your budget.
Related posts:

by Fronetics | Jul 5, 2016 | Blog, Data/Analytics, Marketing, Social Media, Strategy

Gauge the effectiveness of your social media strategy using these four data points in Google Analytics.
Measuring the impact social media has on business is important to those in the logistics and supply chain industries. In fact, a recent Fronetics survey found that 81% of respondents reported that information on proving social media ROI would be helpful to their companies.
You can waste a lot of time trying to track down information on your various social accounts, or you can find all the most pertinent information with one tool. The best part is that your company is probably already using it. (And it’s free!)
Google Analytics is an incredible tool for businesses large and small looking to gain insight into the who, when, and where of their web traffic. And while it may seem intimidating to the novice, it’s very easy to use once you know where to find what you’re looking for.
Step 1: Look at where your traffic is coming from.
Is it social media? Google Analytics will provide an overview of the overall traffic sources that deliver visitors to your website. Included in this report will be traffic from social media. This high-level view of your traffic that includes:
- Search (people clicking through from Google or Bing)
- Social (Twitter, Facebook, etc.)
- Direct (people typing your site in their browser or bookmarks)
- Referral (people clicking links from other sites to get to you)
- Email
- Paid search
- Other
To access this report in Google Analytics, go to Acquisition > All Traffic > Channels.
Go a step further and review the volume of traffic that comes from specific social media networks, by clicking on Acquisition > Social > Network Referrals.
It’s important to have a diverse mix of traffic sources, which should be reflected in the traffic sources report. If you find that a large portion of your traffic comes exclusively from one source, especially if that source is not social media, it is time to reconsider your social media strategy. Similarly, if you are finding that one network is driving most of your traffic, you should look into when and what you are posting in the non-performing channels.
Step 2: Determine revenue derived from posts.
Make sure to include links back to your site when you post on social media so that Google Analytics can track and analyze them. You’ll want to add a UTM code (aka UTM parameter), which is text added to the end of a URL (after the ?) to identify the success of a campaign. As an example, the UTM code is boldface below:
“https://fronetics.com/microsoft-linkedin-product-synergies-floor-b2b-marketers/?utm_content=36244275&utm_medium=social&utm_source=facebook”
You can set unique UTMs for all of your social media, per channel, or even per update. By analyzing your different UTM parameters, you can determine which URLs are most effective in driving users to your content.
Set UTM parameters through Google’s URL Builder. once your parameters are set, you can go to Acquisition > Campaigns > All Campaigns to see the revenue from any individual UTM tag, like a post or tweet.
Step 3: Look at how your content is being digested.
Analytics allows you to see how long a visitor stayed on your site, (use the Duration goal to find out). Examine how content resonates with the social media audience by using Set up the Pages/Screens per Session goal, or learn how many times visitors from social media play website video with Create an Event goal for specific tracking.
Step 4: What is social media bringing you in conversions?
Google Analytics has conversion funnel reports that show how much social media is contributing to conversions. To set up conversion funnels in Google Analytics:
- Use the Goals section and connect any type of conversion event.
- Access your funnel report through Conversions > Multi-Channel Funnels > Top Conversion Paths.
These four insights from Google Analytics can help you determine how effective your social media strategy is in terms of traffic, direct revenue, visitor behavior, and conversions. Use this information to continually refine your strategy and get the most out of your social media presence/
Related posts:


by Fronetics | Feb 25, 2016 | Blog, Content Marketing, Data/Analytics, Marketing, Strategy
https://www.flickr.com/photos/132604339@N03/22920388895/in/photostream/
The most efficient lead-generation strategy includes a way to capture potential customers’ information.
An effective lead-generation campaign requires several different strategic layers.
Firstly, you must entice potential customers with an exclusive, high-value offer — like ebooks, whitepapers, free consultations, product demonstrations, or discounts. A clear, highly visible call to action (CTA) or two can help ensure they know how to attain it and can encourage them to choose it over your competitors’ offers.
But you’re not done there. Unless you are capturing those quality leads effectively, you could be dropping the ball and missing out on potential customers.
Here are some tips for successfully capturing leads.
You absolutely need to have a landing page for your offer. Your CTA should not take the potential customer to your website’s homepage or anywhere else, but rather to a landing page, which provides your offer and captures the lead information.
Landing pages are one of the most important elements of lead generation and are effective for 94% of B2B and B2C companies, according to research done by MarketingSherpa. A great landing page:
- Describes the offer
- Does not include links to other things on your website that will distract the lead and perhaps send them elsewhere before you can obtain their information
- Is simple and not cluttered with information but emphasizes the benefits of your offer
- Has ways to share the offer on social media
- Has a form to capture the lead information
Capturing leads: It’s all in your form
The last point suggests the next step in your strategy: A good form is how you will successfully capture those leads. It is where your potential customers will provide their contact information in exchange for the special offer you have enticed them with.
So, what makes for a good form?
- Keep it short. The fewer fields you have in a form, the more likely you will receive conversions.
- Avoid using the word “submit” on your form. Nobody wants to submit their information, so use a phrase that demonstrates that they are getting something they want by supplying their information — something simple like “Get it free,” or “Download now.”
- Add a privacy message (or link to your privacy policy) that indicates their email or contact information will not be shared or sold.
Want more leads? Use multiple channels
To generate and capture the most leads possible, completing these steps in just one of your marketing platforms is not enough. Marketers should utilize multiple channels in order to maximize their lead-generation efforts.
The objective is to make it easy for buyers to research, evaluate, and purchase products in any way that is most appropriate for them. Some leads may find you through your blog, some through social media, and some through organic search (which is why all of your content should be SEO-friendly). Thus, you should make sure you are promoting your special offers, effectively placing CTAs, and properly using landing pages and forms in every facet of your digital presence.
Such an efficient, multi-layer lead-generation strategy can reduce your cost per lead while delivering higher quality prospects to your sales team.
Want to learn more? Download for a complete list of innovative tips and proven strategies to improve your lead-generation and -nurturing strategy.
Download guide
Related posts:

by Fronetics | Jan 14, 2016 | Big Data, Blog, Data/Analytics, Strategy, Supply Chain
 Fronetics Strategic Advisors is a leading management consulting firm. We advise and work with companies on their most critical issues and opportunities: strategy, marketing, organization, talent acquisition, performance management, and M&A support.
We’ve gathered our most-read big data articles of 2015:
With current technologies, there are increasing amounts of information to be gathered and exchanged in the world, creating more opportunities for businesses to harness that information and chart a course, or to tweak processes based on that information. According to an Accenture study, “97% of executives report having an understanding of how Big Data analytics can benefit their supply chain, but only 17% said that they have implemented it in at least one supply chain function.” Read the full article.
KPMG recently conducted a survey of 144 CFOs and CIOs with the objective of gaining a more concrete understanding of the opportunities and challenges that big data and analytics present. The survey found that 99% of respondents believe that data and analytics are at least somewhat important to their business strategies; and 69% consider them to be crucially or very important. Despite the perceived value of big data, 85% of respondents reported that they don’t know to analyze and interpret the data they already have in hand (much less what to do with forthcoming data). Read the full article.
Forget for a moment the potential of adopting big data analytics throughout the entire supply chain, and consider instead how big data can untangle and integrate seemingly unrelated masses of data to solve small problems in a warehouse or distribution center. That’s exactly what this company did. Read the full article.
Executives are eager to jump on the bandwagon, too. Although only 13% of 250 executives surveyed by Accenture said they use big data primarily for predictive purposes, as many as 88% indicated big data analytics is a top priority for their company. With an increasing number of companies learning to master the precursors to developing predictive models — namely, connecting, monitoring, and analyzing — we can safely assume the art of gleaning business intelligence from foresight will continue to grow. Read the full article.

by Fronetics | Nov 25, 2015 | Blog, Data Security, Data/Analytics, Strategy

Apple has been making lives easier for years with its personal electronics devices, and its new step towards security will bring relief to many people and, in the age of BYOD (bring your own device) many businesses with be grateful. An increase in two digits, from four to six, might not sound like a big difference, but, in fact, it is. With a four digit passcode there are only 10,000 possible combinations, and the bump up to six digits allows for 1 million possible combinations. According to the website Cult of Mac, “With a brute-force computer, it takes on average 40 seconds to attempt every passcode; theoretically, it would take a maximum of 111 hours, or 4.5 days, for a computer to crack a four-digit passcode. Bump it up to a six-digit passcode and it’d take the same machine 11,000 hours, or 458 days.”
The Age of Flexible Work Arrangements & BYOD
Companies and employees are increasingly going the route of allowing personal devices to be used in the workplace, and allowing people to work from home. According to a recent study by the Quarterly Review of Economics, people who work from home are more productive (the study showed a 13% increase), less exhausted, and less likely to leave a job. As more people work from home and on the road, and want to immediate access to their personal and professional information, BYOD has become popular.
According to a thorough Ponemon Institute study on the security impact of mobile device use by employees, many employees want to use their cell phones, but don’t have a full grasp of how security is being impacted or could be breached. Here are some telling numbers:
- 70% of respondents said that BYOD makes them more productive because they have access to personal and professional information in one spot
- A total of 62% of the respondents reported that access to corporate information via mobile devices is “essential” to productivity
- 38% said that they are more efficient and work time was reduced by roughly 30 minutes
- Only 20% of participants reported receiving training on security of corporate content on mobile devices. Of those who were trained, 74% reported that it was not helpful in reducing security threats on mobile devices.
- 66% said that they “frequently” or “sometimes” download apps that aren’t approved by their companies
- Only 19% check for viruses or malware, and 22% believe this behavior invites any danger to their company
Can a Passcode Fix Security Problems
Apple’s new security option is going to help, no doubt. Breaching a password is one issue, but security concerns extend beyond passwords. One of the major benefits of Apple’s new passcode option is that many companies will have to review their mobile device policies. Emails, client information, legal documents, finances, and other important information are sent from and stored in mobile phones. To say this is delicate information is an understatement.
Here are some suggestions for tightening security:
- Review all vulnerabilities in security including devices, networks, and applications
- Require password protection
- Have detailed security protocols for each electronic device
- Determine which activities can be performed and which can’t on devices
- Consider periodic IT check-ups on devices
In the modern workplace, being able to balance flexibility with security is key to a productive and safe business. Properly training employees, setting clear expectations, and instilling trust in employees is important. If employees are trusted they will want to protect your company’s valuable information, but they can’t do the right thing without clear and accessible policies.
This post originally appeared on Electronics Purchasing Strategies.


