by Fronetics | Jun 5, 2019 | Blog, Content Marketing, Logistics, Marketing, Robotics & Automation, Social Media, Supply Chain
When it comes to digital marketing, social media is here to stay. Here’s our four-step guide to leveraging social media for the robotics industry.
Highlights:
- Having a documented strategy is key to reap the benefits of social media marketing.
- Define your audience and establish concrete goals for social media campaigns.
- Set metrics and use data to adjust your strategy consistently over the long term.
The demand for high-performance robotic systems is growing steadily and showing no signs of slowing down. In fact, New Equipment Digest predicts that the robotics vertical within the materials-handling-equipment sector will grow by over 8%, reaching $20 billion by the year 2024. To capture the benefits of the sector’s growth, robotics companies need to invest in digital marketing. Social media for the robotics industry holds tremendous potential — if it’s leveraged properly.
In our work with clients across various verticals in the supply chain, including robotics, we frequently hear that they have been skeptical about the potential of B2B social media use. While social media management does require time and resources, robotics companies should absolutely be reaping the benefits of social media marketing.
Read on for tips on how to create a strategy and leverage social media for the robotics industry.
4 steps to developing a strategy for social media for the robotics industry
1) Define your audience.
For supply chain companies, one of the biggest predictors of success in a social media marketing campaign is a clearly documented strategy. A big part of that is defining your target audience. Chances are, you have some target buyer personas already. Keep these top of mind as you create your social media strategy.
What are the unique needs and challenges faced by your audience? Where do they go online for information? What are their goals? What do they value from you? The more you ask and answer questions about your audience, the better positioned you are to create a strong and effective social media strategy.
2) Determine your goals.
Next, consider what your goals are on social media. You’d be surprised how often this step gets skipped. Marketers are often pressed for time or resources and think of social media marketing itself as a goal, rather than defining specific, measurable objectives for their social media campaigns.
When it comes to social media for the robotics industry, common goals often include increasing brand awareness and authority, generating leads, or establishing thought leadership. But before you embark on a social media strategy, consider what your company specifically needs to achieve.
3) Define your metrics.
One of the best things about having documented goals for your social media strategy is that it helps you define what metrics you should be using to track your progress toward those goals. Measuring social media ROI is no easy task, but there are plenty of tools and strategies that can help. While your full list of metrics will be determined by the goals you set, robotics companies should be tracking at least these four metrics:
- Where traffic is coming from
- Revenue derived from posts
- Visitor behavior on your site
- Social media conversions
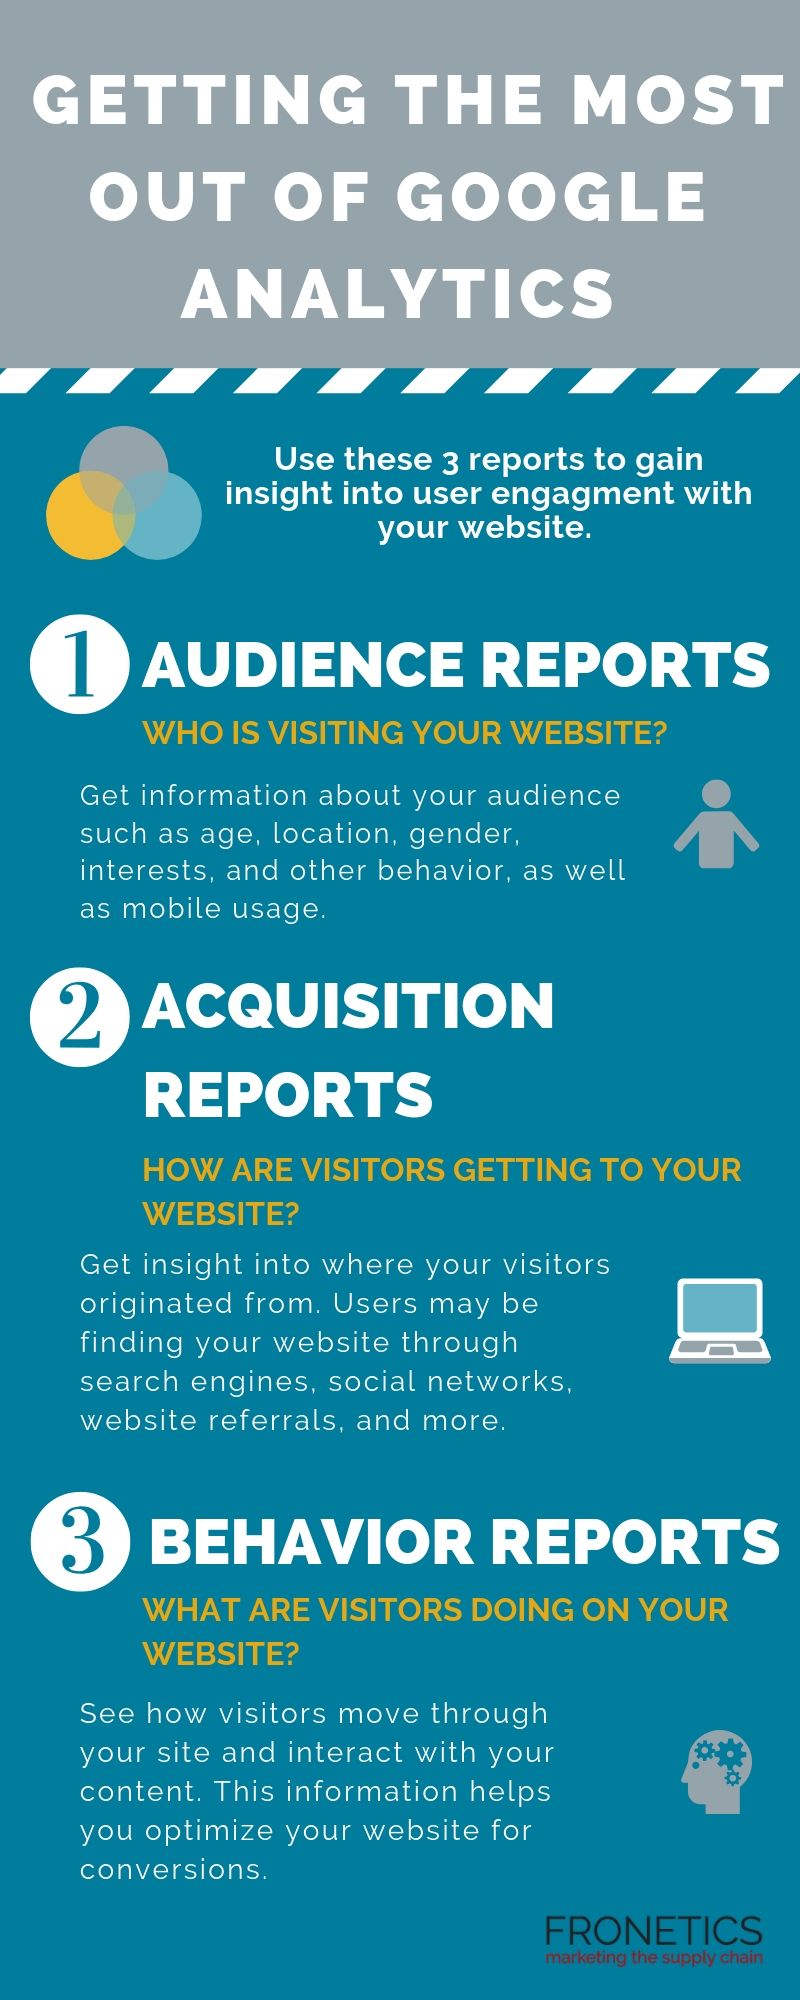
In addition to the analytics tools offered by social media platforms like Facebook, Twitter, Instagram, and LinkedIn, Google Analytics can give you a bird’s eye view of your social media efforts, as well as delving into detail on the metrics that matter most to you. For more, be sure to check out our guide to getting the most out of Google Analytics.
4) Choose your platforms.
Not all social media platforms are created equal. When it comes time to choose your social media platforms and create a strategy for each, it’s important for robotics companies to consider where their audience spends their time online (see step 1).
As you identify what social media channels are the best fit for your company, keep in mind that the characteristics of each platform should inform what content and how often you should be posting. Twitter, for example, lends itself to short-form, pithy content or links and frequent posting, while a more visual platform like Instagram only requires 1-2 posts per day.
Going forward: using your metrics to stay agile
Once your strategy is established, you can simply put it into place, start posting content, and forget about it, right? Wrong. Effective use of social media for the robotics industry requires ongoing evaluation and adjustment.
If you’ve defined the right metrics to track, the data you collect should help you determine where your efforts are successful and where your methods need to be adjusted. As you refine your strategy and learn the needs and preferences of your target audience, you’ll find that social media is an extremely effective tool for capturing leads, broadening your brand’s reach, and building your reputation.
Related posts:


by Fronetics | Jun 4, 2019 | Blog, Data/Analytics, Marketing
There is a lot marketers can learn from data collection that can be helpful in the buyer’s journey. However, with all this information comes challenges. Here’s how to overcome the challenges of data-driven digital marketing.
Highlights:
- Data is a key component in driving decisions when it comes to digital strategies.
- Try using analytics tools that take into account all of your data activity and tracks it through all of your channels and platforms.
- The key to using data to optimize your marketing efforts is the ability to collect and analyze the data.
Video transcript:
I’m Jennifer Yim, the Director of Strategy here at Fronetics, and today we’re going to be talking about how to overcome the challenges of data-driven digital marketing.
Data is a key component in driving decisions when it comes to digital strategies. And there are a lot of things marketers can learn from data collection. Those can be helpful in identifying opportunities along the buyer’s journey. But all this information comes with its own set of challenges.
Here are the three of the biggest challenges of a data-driven strategy and how to overcome them.
1. Finding the right data and KPIs
There is no point in tracking data if it can’t be used to serve a purpose. Digital marketers need to give the data meaning by utilizing the numbers they’re collecting.
Once you finalize a strategy, start tracking the specific data points that contribute to those KPIs. Some of the most important KPIs are website traffic, engagement rates, and conversions. And remember, time is a key factor in analyzing data.
2. Having the right platforms and tools
As a marketer, you need the right tools to determine what’s working and what isn’t. Try using analytics tools that takes in all your data activity and tracks it through all of your channels and platforms. This will give you a full picture of what is happening throughout the buyer’s journey and will also help you make more informed decisions about tweaking your strategies.
3. Bringing it all together
The key to using data to optimize your marketing efforts is the ability to collect and analyze the data. Keep consistency in how you report and organize your results and use this insight to drive your marketing strategy. What’s working? What can you improve? Constantly be working to make your marketing plan to align with your top performing digital marketing efforts.
You can learn more at Fronetics.com.
Related posts:


by Fronetics | May 30, 2019 | Blog, Current Events, Marketing, Social Media
Also, this month in social media news: Facebook shows marketing decline; Instagram introduces unfollower statistics for creators; and YouTube adds still-image ads.
Highlights:
- Facebook announces a new redesign that puts Groups at the center – and brands on the outskirts.
- For the first time in 5 years, Facebook marketing is in decline.
- Instagram is testing small changes that could make a big difference for brands.
It’s been a big month in social media news. Kicking things off, Facebook held its annual F8 developer conference, giving the world some insights into the platform’s future, including long-term goals. Just one week later, Social Media Examiner released its annual Social Media Marketing Industry Report, which showed a decline in Facebook marketing in general.
In the meantime, YouTube is rolling out a new development for advertisers: still image ads. LinkedIn has updated its Job Search tools, and Instagram is empowering creator accounts with data about unfollowers and new likes. Read on for a roundup of social media news from May 2019.
Facebook Holds Its Annual F8 Developer Conference
From April 30-May 1 in San Jose, CA, Facebook gave developers some glimpses into its long-term goals and strategies. Perhaps the biggest news from the conference is the complete redesign of both its desktop and mobile versions. While the redesign has some aesthetic changes, the important thing for marketers to know is that Facebook is now structuring itself around Groups. As Facebook reported, the new design “puts your communities at the center.”
It’s official: Facebook is departing from the News Feed focus, and instead continuing to turn toward being a more friends-focused platform. In the wake of Cambridge Analytica, Facebook is continuing its push to restore user confidence — and in doing so, it’s clearly demonstrating that Facebook is a decreasingly friendly place for brands. Marketers need to stay abreast of the ongoing changes and shift their Facebook strategies accordingly. Keep an eye on our monthly social media news roundups for updates.
New Report: Facebook Marketing Decline
The Social Media Marketing Industry Reportis out, and its findings offer some surprises — at least on the surface. In a reversal of trends from the past 5 years, there is a clear indication that marketers are turning away from Facebook. While this doesn’t mean that marketers are turning away from Facebook entirely, it does mean that they are diversifying their social advertising. One in 10 marketers indicated that they’ll be decreasing their organic marketing on Facebook, and only 51% plan to increase their organic activities, down from 62% in 2018.
LinkedIn Updates Its Job Search Tools
LinkedIn is continuing to build quietly on its success as a highly respected, professional platform. According to LinkedIn’s announcement of recent changes to its Jobs tools, “We’ve grown from 300,000 to 20 million job postings in the past five years, with members applying to 25 million jobs every week and a new hire made every 8 seconds using LinkedIn.”
The network has redesigned its Jobs section, with the goal of catering better to user needs. The homepage is now more streamlined and less cluttered, and more focused on advertising roles, making it easier for users to scan quickly through available opportunities. The platform is also revamping its job alerts system, giving users instant, personalized alerts about available opportunities. It’s also making its Salary Insights data available to all members.
Instagram Separates New Likes on Posts and Adds Unfollower Stats for Creator Accounts
Instagram is testing out some options that will help businesses easily see activity and take actions based on it. The platform is now sorting the Likes section for creator accounts into “Earlier” and “New” sections, helping businesses easily distinguish the latest activity. The feature has been on Android for several months but is new for iOS.
Similarly, Instagram creator accounts now have access data on followers and, notably, unfollowers. This is valuable data for marketers, as it provides context on content and overall account performance.
YouTube Adds New Still Image Ads
YouTubehas announced that it will soon begin providing non-video advertisers with a new still-image option that will appear within YouTube home feeds. “For a long time, advertising on YouTube meant your brand had to have a video or app ad,” says the announcement. “We’re excited to announce today that’s no longer the case.”
YouTube is calling the feature Discovery Ads, and it will use audience targeting to display ads to relevant users based on their activity. “Discovery ads are a simple and effective way to tap into the power of YouTube — and you don’t even need a video. Just upload your best images from your social campaign, then we’ll optimize your media mix for maximum performance across Gmail, Discover and the YouTube Home feed.”
What social media news caught your eye this month?
Related posts:


by Fronetics | May 29, 2019 | Blog, Content Marketing, Data/Analytics, Marketing
These Google Analytics reports are crucial to understanding the visitors who are browsing your website and how you are more likely to get them to convert.
Highlights:
- Audience reports tell you who is visiting your website.
- Acquisition reports convey how are users getting to your website.
- Behavior reports show what visitors are doing on your website.

(Made with Canva)
Your website is your best opportunity to convert digital prospects into leads. But how can you learn who is browsing your website and what they are doing while they’re there? Most importantly, how can you get more of them to convert? Here’s where tools like Google Analytics can help.
Google Analytics is one of if not THE most comprehensive analytics tools available to digital marketers. But it can be very overwhelming if you don’t know how to navigate it. So, we’ve come up with the 3 Google Analytics reports you should be running if you want to understand how to get more visitors to convert on your website.
But, first, let’s start with the basics.
Understanding Google Analytics
At a fundamental level, Google Analytics helps you understand and make decisions based on the traffic that comes to your website. This free tool is a powerhouse that uses a JavaScript code to collect data surrounding how users interact with your website. It then processes that data and generates customizable reports for you within the platform.
I should say: the data you gain from Google Analytics is all the richer if you begin by setting up Goals on the platform. This way, Google Analytics can go to work for you, measuring how well your website is fulfilling your specific objectives. If you start by properly setting and configuring your goals, Google Analytics can provide you with critical information that’s specific to your strategy. Of course, you can always add to or adjust your goals, as you collect data.
Getting the most out of Google Analytics can empower you to make improvements to your website based on the data it collects for you. The more information you have about your site and its traffic, the more you can make adjustments to meet your objectives. Furthermore, the insights you gain from your metrics can help shape future objectives, to improve user experience on your site.
3 Google Analytics reports that are key to getting the most out of the platform
Using Google Analytics, you can gain insight into some of the most important questions surrounding user engagement with your website. In particular, these 3 reports are helpful in getting the most useful data for understanding lead conversion opportunities:
- Audience reports: Who is visiting your website?
- Acquisition reports: How are users getting to your website?
- Behavior reports: What are website visitors doing on your website?
Here’s what you need to know about each report.
1) Audience reports
As you create and publish content on your website, you need to know who’s reading/watching/viewing/listening to it. With Google Analytics, you can get information about your audience such as age, location, gender, interests, and other behavior.
As users are increasingly engaging with websites on mobile devices, we often encourage clients to monitor the Mobile report as well as other audience demographics. This report shows you what percentage of your audience comes from a mobile device, as compared to a desktop or tablet. You need this information, particularly because mobile device users tend to have different behavior and goals from those on desktops. If your traffic is heavily mobile, your site needs to be optimized for these visitors.
We also encourage clients to make use of Google Analytics’ audience benchmarking reports. These reports allow you to compare your results with aggregated industry data, giving you the context you need to set targets. Benchmarking can also give you insights into industry-wide trends and help you determine how you’re doing as compared to your competitors.
2) Acquisition reports
Knowing how visitors are getting to your website will empower you not only to improve your site, but to make strategic decisions surrounding your other digital channels. Google Analytics offers acquisition reports that provide insight into where your visitors originated from. Users may be finding your website through search engines, social networks, website referrals, and more.
Use the Acquisition Overview to get a quick overview of the top channels that are funneling visitors to your website. You can also see associated acquisition, behavior, and conversion details for each of these channels. If you have your Google Analytics Goals in place, the Acquisitions Overview report will display how well each channel is driving conversions.
Next, take a deeper dive in the Channels section, which gives you rich information about each of your channels. For example, if you click on the “Organic Search” channels, Google Analytics takes you to the Keywords report, which lets you know how you’re faring with specific search queries. Clicking the “Direct” channel will take you to the top landing pages for direct site visitors, and “Social” shows you your top-referring social networks.
3) Behavior reports
Once visitors are on your site, what are they doing there? If you’re getting the most out of Google Analytics, you can see how visitors move through your site and interact with your content – and, in turn, you can be strategic about optimizing your website for conversions.
Start with the Behavior Overview. Here, you’ll find a graph of the amount of traffic your website receives, as well as additional metrics such as Pageviews, Average Time on Page, Bounce Rate, and more.
For more insight, the Behavior Flow report shows you the path users typically take on your website. You can see the first page they view, all the way to the final page they typically visit before exiting your site. Here, you’re getting a visual of how long visitors stay on your website — and learn a bit about why they leave.
The bottom line: Google Analytics reports help you optimize your website
Data empowers you to make informed decisions and tailor your strategies to meet your objectives. Not only that, data can help you determine your objectives in the first place. Google Analytics is perhaps the most robust tool out there for gathering information and insights into essentially every aspect of your website. Make sure you’re making use of it.
What Google Analytics reports have you found most helpful?
Related posts:


by Fronetics | May 23, 2019 | Blog, Content Marketing, Marketing
Measuring brand awareness is a notoriously difficult task. Here are our favorite tools to help you refine your efforts.
Highlights:
- Tools for measuring brand awareness fall into two categories: social analytics tools and social mention tools.
- Our top 3 social analytics tools: Qualtrics, Ahrefs, and Brandwatch.
- Our top 3 social mentions tools: Netvibes, Mention, and Buffer Reply.
We often hear from our clients that measuring brand awareness is one of the slipperiest tasks when it comes to digital marketing. It’s a notoriously difficult marketing element to track, and not having an accurate picture can also make it difficult to evaluate the success of your overall digital marketing efforts, as well as to calculate ROI.
Luckily, there are tools that can help. Broadly, these tools for measuring brand awareness fall into two categories: social analytics tools and social mention tools.
- Social analytics tools are designed to help you determine the times your actions get the most engagement, as well as more detailed user demographics and interactions with your brand.
- Social mention tools track overall mentions for your brand, letting you see everywhere your brand has been mentioned and helping you determine which platforms are performing best for your content.
Here are our top three favorite tools in each category for measuring brand awareness.
Top 3 social analytics tools for measuring brand awareness
1) Qualtrics
Qualtrics boasts that it is “software to help turn customers into fanatics, products into obsessions, employees into ambassadors, and brands into religions.” While supply chain companies will likely raise an eyebrow at such lofty claims, this tool really has the potential to perform for B2B customers. Ideal for complex supply chain business, Qualtrics offers a variety of tools that measure buyer experience, brand experience, product experience, and employee experience.
2) Ahrefs
Ahrefs isn’t exactly a new kid on the block when it comes to measuring brand awareness. The company started in 2011, and has continued to update and add new features regularly, keeping it on the cutting edge of SEO tools. It’s one of the best backlink analysis tools available. Perfect for just about any business, the platform notably helps you analyze why your competitors are ranking in particular areas and what you can do to outrank them.

3) Brandwatch
Some of the most successful brands in the world have been empowered by Brandwatch, which is arguably the leader in social intelligence. The robust analytics features include insights within millions of online conversations, as well as optimized target influencer and other paid social campaigns. It also boasts its Vizia platform, which shares insights with decision-makers throughout your organization, promoting aligned efforts.
Top 3 social mention tools for measuring brand awareness
1) Netvibes
Netvibes lets you easily monitor all your digital assets, as well as customize them based on the insights it provides. Not only can you follow your social networks for brand mentions, you can create alerts for breaking news or publications on key topics. Additionally, you can gain valuable insights by filtering your mentions by author, date, location, language, company, and even more.
2) Mention
Mention lets you monitor your campaigns anywhere online, and “scour the web, social media, and more for powerful market insights.” The platform offers real-time monitoring, letting you get live updates as you launch a campaign, for example. You can create custom insights, involving everything from social media, forums, blogs, and virtually every bit of the web.
3) Buffer Reply
We’re including Buffer Reply because it’s unusual in its focus. While other tools give you access to all your mentions on the web, Buffer Reply lets you hone in on a specific target client or demographic. The platform shows you everything you need to know about the client you’re talking to, each time they’ve mentioned or interacted with your brand. We recommend using it in conjunction with a broader tool like Google Alerts.
Related posts:


