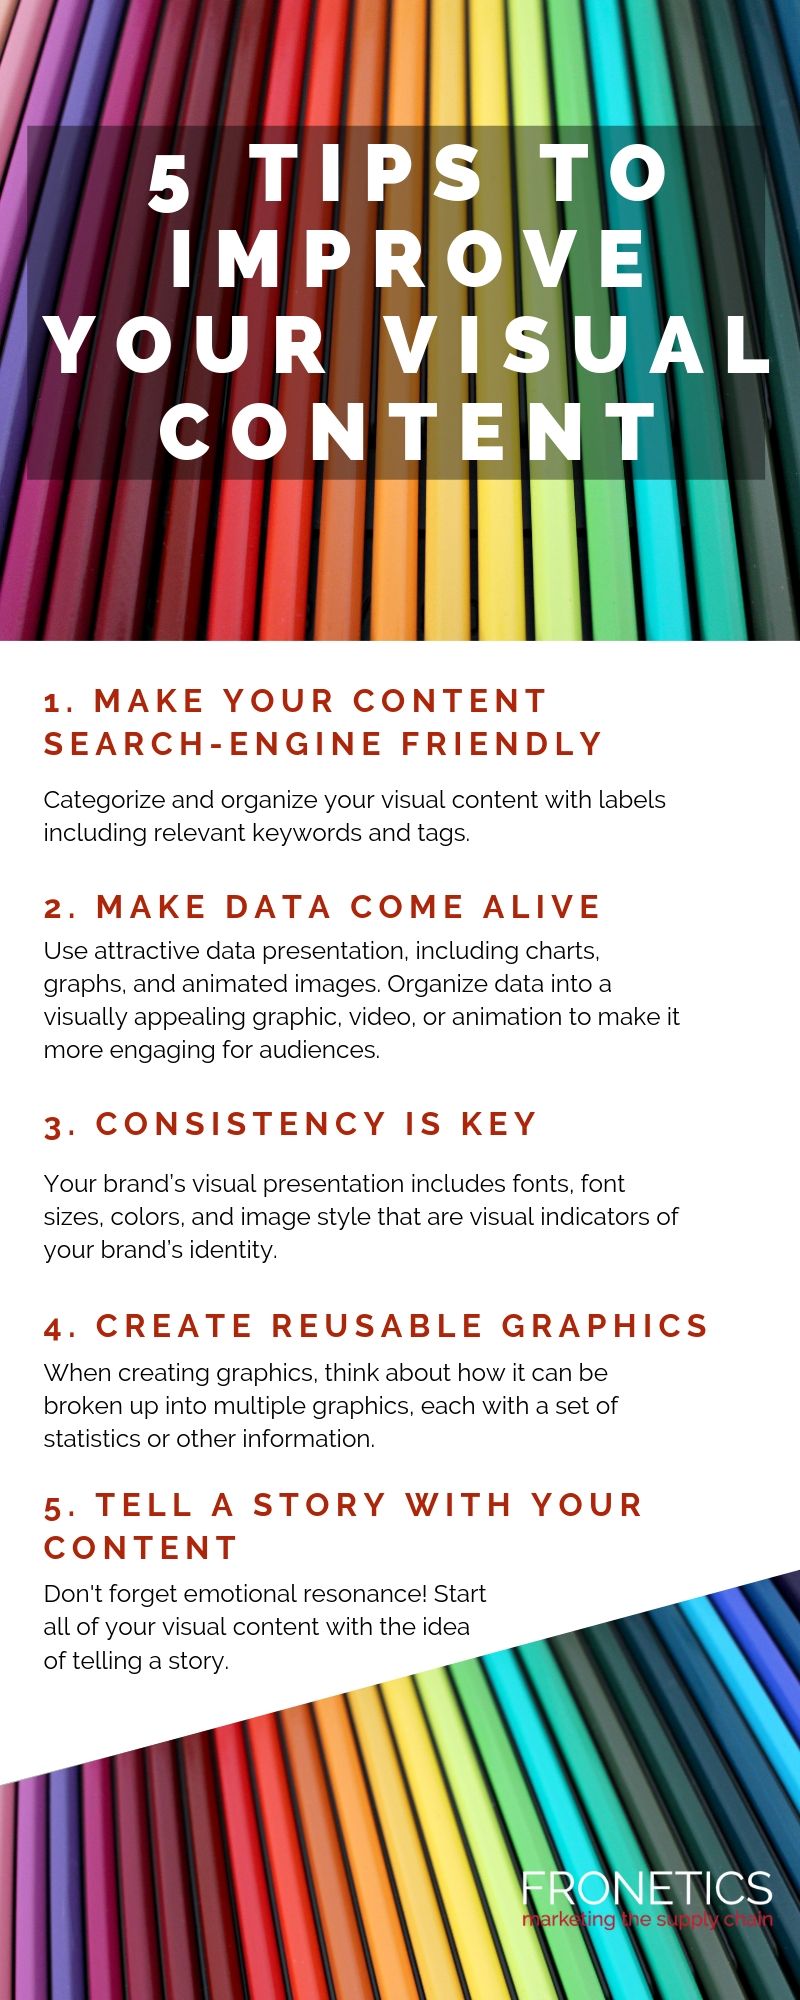
As digital natives flood the purchasing landscape, visual presentation is critical. Our infographic offers tips to improve your visual content to resonate with today’s buyers.
Highlights:
- Visual content can be more easily digestible and compelling than purely text-based content.
- Optimize your visual content for search engines by accompanying it with searchable text and tags.
- Keep branding consistent with a unified color scheme and fonts.
The internet is becoming an increasingly visual space, and brands are feeling the pressure to stand out from the masses. But making an effort to improve your visual content doesn’t have to be an arduous chore. In fact, the type of complex information that supply chain marketers often need to present can be far more easily digestible in graphic format.
Strategically created and distributed content that is design-minded and visually appealing is your brand’s best friend. Our infographic offers 5 ideas to improve your visual content efforts, with a focus on broadening your brand’s reach, engaging your audience, and generating leads.
5 tips to improve your visual content

1) Make your content search-engine friendly.
In the same way that social media analytics are struggling to keep up in an increasingly visual climate, search engines have yet to be effective at searching visual content. No matter how compelling your visual content, you won’t be getting the most out of your efforts unless you optimize your content for search engines.
There’s a simple solution to make sure your visual content makes it to the top of relevant search queries: post a text transcript with video or accompanying explanatory text with infographics and images. You can also make sure your visual content is easily searchable by categorizing and organizing it. Label visual assets like logos and images with relevant keywords, and tag them when publishing.
2) Make data come alive.
When it comes to presenting the kind of turgid data that’s often inherent in supply chain purchasing, visual formats are a marketer’s best friend. Supply chain marketers are ideally positioned to make use of attractive data presentation, including charts, graphs, and animated images. Organizing data into a visually appealing graphic, video, or animation makes it far more engaging and digestible for your audience.
3) Create reusable graphics.
Whether you’re creating visual content in house or outsourcing visual content creation, it behooves you to consider how it can be reused. When designing an infographic, for example, think about how it can be broken up into multiple graphics, each with a set of statistics or other information. You can combine these smaller graphics to other pieces of text content, adding visual appeal and boosting engagement.
These visual snippets are also ideal for posting on social media as teasers to link to fuller visual assets.
4) Consistency is key.
One of the most important things you can do to improve your visual content is make sure it’s consistent. Your brand’s visual presentation includes fonts, font sizes, colors, image styles, and any other graphic elements that are visual indicators of your brand’s identity.
Make sure all content creators in your organization receive clearly documented visual guidelines, along with samples for their use. Every time you publish visual content, include checking these guidelines as part of your editorial process.
5) Tell a story with your content.
The difference between good visual content and great visual content ultimately boils down to one thing: emotional resonance. The most significant way you can improve your visual content is to start with the idea of telling a story.
Ideally, you’re presenting data in a way that communicates a feeling and elicits an emotional response from the viewer. If your data is impactful, your viewers will forge an emotional connection with your brand.
What tips do you have to improve your visual content?
Related posts:


